Takeaway #1 from #NCTM2019: Equitable teaching practices.

This is my first post in a LOONG time.  It’s been quite a year. Without getting too detailed:

  1. I left my last school (after 18 years) to help build a mathematics program at a new school. I love this new community, and I love the support I’ve received to build a math program guided by equity, inquiry, safety, and good teaching & learning.  It will be a long journey, but one I am glad I began.
  2. I know I needed to revisit lots of the professional development I’ve enjoyed in the past 10-15 years through this new lens. In many ways, I’m “Back at One.” In particular, I need to more deeply understand my responsibility to teach in a way that convinces my students that they will be okay taking risks, being themselves, and making mistakes.  Too often, the  fear of judgment, being dismissed, being deemed stupid / lazy / disruptive.

Last week I spent a killer week in San Diego attending The National Council of Supervisors of Mathematics and National Council of Teachers of Mathematics  research sessions, events, and presentations.

To summarize all of it?  I felt welcomed.  I felt appreciated. I felt like my colleagues and friends were ready to hold me accountable. I felt challenged. I felt like part of a team.

It reminded me of when I saw this on the Oprah show in 2000, with Toni Morrison:  “Does your Face Light Up when they enter the room?”  

The session that had the most impact, among a slew of very good presentations:

HANDS DOWN:   Dr. Imani Goffney, University of Maryland:  “From Oakland to Wakanda:”  Transforming Mathematics Classrooms to Become Empowering Spaces.  I cannot overstate the impact this presentation had on me.  I was most impacted by that fact that  I grew and blossomed as a teacher because of the compassion, kindness, and expertise of colleagues who took active steps to believe in my potential and see brilliance in me.  I was emotional upon reflecting how crucial these assumptions and extensions of trust were to my own growth as a student and as a teacher.

She expertly revealed common assumptions and practices that shut down these possibilities for students of color, and ways to move our classrooms from de-humanizing experiences to re-humanizing experiences. What I especially loved: It is grounded in deeper mathematical understanding, and deeper understanding of the students I teach. Two ways to re-leverage common practices:

  1. Work from the assumption of the brilliance of Black and Brown students (like we unconsciously do more often with White and Asian students).
  2. Collecting feedback on the impact of my own decisions in class.

CTMZh8JkQ4u9n6LO9xXc2Q.jpg

+BlRnr4DQe+bj4ijNMwyJA.jpg

img_0275-1.jpg

Me, Dr. Imani Masters-Goffney, Dr. Nicole Bannister

This is what I will be working on.


Posted in Uncategorized | Leave a comment

Twitter Math Camp 2017: “I want to cultivate a relationship with you.”

I’m back home in West Hollywood, enjoying coffee and recovering from a wonderful week at  Twitter Math Camp 2017. What the hell is Twitter Math Camp (TMC)?

Well, it’s a get-together of kindred spirits who have connected over the years  who have ambitious goals to help folks learn and love mathematics,  The loosely connected group gave themselves the name the “MathTwitterBlogosphere (#MTBoS).”  It’s one of the many communities of teachers that I identify with.

I have had the privilege of belonging to many different communities of teachers since I started teaching in 1995. Let me list some (with hashtags – some real some not):

  • The Gay Lesbian Straight Education Network  (GLSEN)
  • The Loomis Chaffee School  (LC)
  • The Loomis Chaffee Mathematics Department  (LCMATH)
  • The Harvard-Westlake School  (H-DUB)
  • The Harvard Westlake Mathematics Department (H-DUB Math)
  • AP Statistics Teachers all over
  • AP Statistics Exam Readers
  • The Park City Mathematics Institute Teacher Leadership Program  (PCMI)
  • the Los Angeles Professional Development Outreach Group (LAPDOG)
  • The Park City Mathematics Institute TLP Staff  (PCMIStaff)
  • Math for America Master Teaching Fellows Program  (MFA-LA)
  • AP Computer Science Principles Teachers Network  (APCS-P)
  • MTBoS: The Math Twitter Blogosphere (MTBoS)
  • Twitter Math Camp Attendees and Presenters  (TMC15, TMC17)
  • The Real HouseTeachers of WestHollywood (Yes! This is a group I identify with during the summers when we are not crazed with appointments and events).

When I look at all of these communities, I think a lot about my feelings of belonging and my feelings of alienation. Within each community, above I have experienced feelings of both.  Why? What made me feel like I belong? What made me feel like I don’t belong?  

I do not know whether these are causes or effects  of  my feelings; maybe a bit of both.

  1. Things I associate with feeling like I belong: 
  • People’s eyes light up and their faces brighten when they see me, and I do the same.
  • People say hello when I walk into the room.
  • I don’t need to prove or defend myself when I share something.
  • I may disagree with someone, but I can learn from them by listening and taking the time to understand them.
  • I feel safe honestly sharing feelings – even when there is conflict or discomfort.
  • I talk to members of my community, not about them.
  • I stay longer than I need to. Time flies.
  • We connect with each other “just because.”
  • We are all working hard, together.
  • I can be sad, or angry, or silly, or tired in front of them, and talk through it, and be okay.
  • I feel light, happy, and joyous.
  •  I care about you, and you appreciate and respect me. So I want to give you my very best. 
  • I feel, in my heart: I am enough, and I am worthy of being here with these folks. 

    2. Things I associate with feeling like I do not belong: 

  • I walk into the room and it’s silent: no hello, no looking up.
  • I feel like “I don’t want to bother them.”
  • I feel like this person will present an obstacle to my goals.
  • I am more concerned with “getting this done” than connecting.
  • I  assume there is a focus on “maintaining professionalism” and keeping conversations “focused and brief.”
  • I/others  want to talk  about people, not with people.
  • Ignoring, “cutting off,”  “distance,” and “icing” are viable behaviors to manage feeling hurt or disappointed.
  • Lots of whispering.
  • I worry that you are going to judge me, because you don’t respect me. So I will work hard to prove to you I’m deserving of your respect. Or maybe not, if that hasn’t worked in the past. Maybe I’ll blow it off. 
  • “When are we done?”
  • I feel like I want to get out of this room.
  • I feel sad. It’s hard for it to go away.
  • I feel the lies my brain is fixated on: that I am unworthy, not enough.  

   3. What does this have to do with Twitter Math Camp? I’ll start with what brought me here this year:  This was the first time I had participated “fully” in Twitter Math Camp: I stayed at the host hotel (instead of commuting, and I did back in 2015) and prepared a three-day workshop with Peg Cagle and Cal Armstrong, two deeply cherished colleagues and friends. Many of you have some really strong bonds within MTBoS. We have cultivated ours over 10-15 years.  IMG_0609

We forged these relationships together during some intense, emotional, and deeply thoughtful years writing the “Reflecting on Practice” curriculum as staff at the Park City Mathematics Institute from 2009-2012. Our  work at PCMI is one of the things I am most proud of as an educator.

We applied to co-facilitate a three-day workshop at TMC2017 about implementing rich tasks. But for me, it was  mostly to re-connect, work together, and re-experience the close connections we made over the years. They are two people I respect, admire, and love very much.  We’ve each succeeded and failed each other in our own ways through the years, but we have steadfastly supported, appreciated, and cared for each other in ways that are tough to replicate. When the shit goes down, I want these people in my corner.  I was able to feel safe implementing the workshop and to open up more to others at the conference.  My sense of trust and belonging with them helped me take more risks and develop a stronger sense of trust and belonging with the  MTBoS community. 

4. OK – enough about you, dude.  So what about TMC? I connected with a lot of folks who were also open, brilliant, willing, joyful, and interested in connecting with me. I saw some friends and colleagues I’ve known for a while (I’m thinking of Chris Luzniak, Sam Shah, Lisa Henry, Tina Cardone) emerge as true pioneers and leaders in the MTBoS community and the larger teaching community. I  deeply admire their leadership, brilliance and bravery.  And I got to meet others folks I only knew through tweets, or a single presentation I saw at a previous TMC, APStats,  or NCTM event. But I was thrilled to connect, in some way with folks like Jed Butler, David Butler, Julie Reulbach, Hedge, Glenn Waddell,  Brette Garner, Ben Walker and too many others I forget right now. All of us made connections, and said, at some level:

 I want to cultivate a relationship with you. 

“Whoa, dude… hold on there. I thought we were just playing Pandemic over IPA’s…”  

This phrase is scary to write:  it’s fraught with commitment and expectations that I am not sure I can meet. It’s fraught with uncertainty about the level of depth and connectedness that may develop.  It’s fraught with being the stalker-y needy colleague.

Ultimately, however, I think this is what we are asking for as we forge our “tribe” of colleagues, friends, mentors, and comrades at TMC.  When we open up to be vulnerable to people that (we hope)  are nurturing,  joyful, able and willing.

The details of how that relationship is formed, what it means, and whether it creates mutual joy is a function of  developing our skills in relationship-building.  

This wonderful synopsis of  “How to Love” by Which That Nanh  by Maria Popova from Brain Pickings  does a great job describing some of the complex work that we all must practice in order to cultivate the kind of relationships that bring us sustained joy, value, and feelings of belonging.  This one quote from the book is my favorite:

To love without knowing how to love wounds the person we love. To know how to love someone, we have to understand them. To understand, we need to listen.

… and listening takes time.  So how have I seem this played out among the folks at TMC?   It comes down to spending time with each other and making time and space to understand and appreciate each other. Meals. Games. Songs. Conversations. Conflicts (managed maturely and bravely).  Shared work tasks. Shutting up and Listening. Resisting reactions and pausing until I can genuinely listen and understand.

5.  Beyond TMC -: For many of you, these discoveries are not new. Recognizing their importance is new for me. I am leaving TMC with a stronger understanding of when I feel I “belong” to a community:

  1. How much time am I willing to spend being open, honest, myself, and vulnerable?
  2. How much time am I willing to spend to understand those I’m with? 

When I take the time to understand, ask, share, and take risks, my community improves.

It’s easy for me to  point to examples where others have, in my judgment failed to be loving, thoughtful, honest, warm, or kind.  But that does not give me license to do the same to them. I have the ability and the responsibility to do something else.

I can be braver about being more assertively welcoming and take a stronger interest in who is in front of me.
I can remind myself that those I don’t particularly enjoy are on the same team with me, and are, like me, doing their very best they can today.
I can do more to not dismiss or cut off someone who did something I did not like.
I can do more to listen and understand.
I can do more to share when I have an issue or uneasy feeling about a friend or colleague within my community.

This is my “one thing” I will be thinking about this year as I begin new work with my colleagues and my students.


Posted in Uncategorized | 1 Comment

Possible Solutions: 2017 AP Statistics Free Response Questions

Hi Colleagues,

After the AP Statistics Exam questions have been released, I put out my own solutions and invite feedback, other approaches, and questions.

Nothing official in these solutions: I have taught AP Statistics for 21 years, and I have graded multiple times. Based in this experience, I put forth the solutions you see here.

Possible Solutions 2017 AP FRQ (First Draft)

I got a bit delayed with putting these out this year, but I did enjoy myself this weekend, so that’s good.  Workouts, friends, and rest are truly essential components of my days anymore. If you are a teacher, don’t underestimate their impact on your own health and well being.  Our profession sometimes glamorizes the false benefits of being the  “overworked martyr.”  I certainly perpetuated this in the past.  Trying to turn over a new leaf in recent years.

Thanks to Amy Crum for her solutions – I checked my own answers with hers before posting them.

Thoughts about the problems:

1: The Wolves problem.  (Basics of linear regression and scatterplots)  Haha!  I LOVE the idea of simply asking what the heck “linear” and “strong” and “positive” mean in this context. I predict that many students will not respond substantively to these questions (You know-  linear means it’s linear!)

2. Water and Soft Drinks. (one sample z-interval for a proportion)  Cool context:  there may be some issues with students correctly describing  the population of interest and the sample of interest in correct context. A common error for my students is to mis-understand the context, and then say something totally incorrect at the end of the problem.

3.  Melons.  (normal models, conditional probability) Great probability problem.  I like the subtle twist on conditional probability in part c).

4.  Pottery.  (making conclusions from boxplots, complex context) Another good,  challenging problem with exploratory data analysis. Students will need to articulate which numbers from which parts of which box-plot(s) are providing evidence for their conclusions.

5.   The Schizophrenia problem. Straight up simple chi-squared test.  I wonder if students will be expected to describe the association after completing the test, or if completing the test is enough.

6.  (Sampling with/ without replacement,  tree diagram probability).  This seemed like a shorter investigative task than in the past.  I wonder what will suffice as “complete” reasoning/ work for each part.  I especially wonder whether student swill be able to “transfer the lesson learned”  from parts (a) and (b) to part (c) without additional work to confirm that this difference  carries through to more complex situations.


Posted in Uncategorized | Leave a comment

AP Statistics Exam, Free Response Questions: Any patterns?

The free response questions for the AP Statistics exam are sometimes hard to predict.  What trends do exist?

Here is A graph relating AP Free response question Number vs.  Chapter in the  5th Edition of The Practice of Statistics.

1:           Exploring Data (single variable, quantitative)
2:           Modeling Distributions of Data  (z-scores, percentiles, normal model)
3:           Describing Relationships
4:           Collecting Data
5:           Probability, the basics
6:           Random Variables, the binomial and geometric distribution.
7:           Sampling Distributions
8:           Inference: Confidence Intervals, 1 variable.
9:           Significance Tests, 1 variable.
10:         Inference for two groups
11:         Inference for categorical data
12:         Inference for regression

Here’s a graph of the relationship. Here are a few trends I observe:

  1. Question 1 tends to be exploratory data analysis OR an easier test about inference.
  2. Question 2 seems to feature probability OR sampling/ experimental design
  3. Question 3 seems to feature probability OR sampling/ experimental design
  4. Question 4 seems to feature an inference procedure often, but not always
  5. Question 5 seems to feature an inference procedure often, but not always.
  6. Question 6 always is a mixed bag, bot often involves some reasoning regarding inference.

Other observations:

  • “Probability, served three ways:”  Probability questions are often, but not always, three-parters that take a single scenario and then “serve up” questions involving three different techniques in probability.
  • Two sample t  vs Matched Pairs t questions are common.
  • Inference for regression, when addressed, is done pretty lightly, and often in question 6.  There are often many other parts to question 6 that are not about inference for regression.

chapter vs FR_question_number

Posted in Uncategorized | 1 Comment

Smelling Like Data Science

This gallery contains 12 photos.

Originally posted on A Best-Case Scenario:
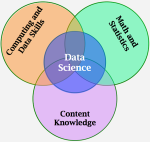
(Adapted from a panel after-dinner talk for the in the opening session to DSET 2017) Nobody knows what data science is, but it permeates our lives, and it’s increasingly clear that understanding data science, and…

More Galleries | Leave a comment

The Lesson of Grace in Teaching

Yes, I’ve started a new blog.  The platform here at WordPress seems to be nicer and more versatile.  I’ll be blogging here from now on. However, my first blog post was at Blogger, becau…

Source: The Lesson of Grace in Teaching

Posted in Uncategorized | Leave a comment

My Possible Solutions: 2016 AP Statistics Free Response Questions

Possible responses to the 2016 AP Statistics Free Resposne questions, draft #1.

You can access the questions here.

Note: I construct these as a service for both students and teachers to start discussions. There is nothing “official” about these solutions. I certainly can’t even guarantee that they are correct. They probably have typos and errors. If you catch some, let me know! But if they generate discussion and help others, then I’ve succeeded.

My first draft: possible solutions, APStatistics FR 2016

Please read, critique, and suggest fixes!

Reflection:

I think that these very accessible questions are attempting to give students a chance to explain their reasoning and thinking with appropriate specificity.  I suspect that students can easily falter in the following ways:

#1:  I wonder if we’ll see students failing to be appropriately specific in using measures of center/ spread. I can see kids giving incorrect values for IQR, and not using range as something much more accessible. I can also see the rubric penalize for not quantifying the amount of increase of the mean.  It possible, so students should probably quantify the increase.

#2.  I wonder if we’ll see students not being appropriately nuanced in explaining the effect of the ads on preference.

#3.   I wonder if we’ll see students not identifying the variables correctly – they will probably identify summary statistics instead.

#4. I wonder if we’ll see students not showing mathematical pathways, and giving a surface-level explanation of part c)

#5. I wonder if we’ll see students not explaining thoroughly enough WHY np and n(1-p) must be greater than 10.

#6. I wonder if we’ll see students not being focused enough in answering the specific question posed in each part.


Posted in Uncategorized | 4 Comments

PDEs Course Design (Part 5): Inclusion and Excellence

Source: PDEs Course Design (Part 5): Inclusion and Excellence

Posted in Uncategorized | Leave a comment

Possible Solutions, 2015 AP Statistics free response questions, Draft 2

Hi Colleagues!   Thanks for the edit suggestions.  Most edits were typos and cleaning up details.  Here is draft #2:  Possible Solutions 2015 AP FRQ

I welcome any critiques, alternate solutions, questions or criticism.

Posted in Uncategorized | 3 Comments

Possible Solutions to 2015 AP Statistics Exam questions, draft 1

Hi Colleagues! 

play_honeydew_beaker_600

Well, here’s my first draft of possible solutions. 

You can access the questions here at AP Central.

Disclaimer: I construct these as a service for both students and teachers to start discussions. There is nothing “official” about these solutions. I certainly can’t even guarantee that they are correct. They probably have typos and errors. If you catch some, let me know! But if they generate discussion and help others, then I’ve succeeded.

The link to my solutions is here: Possible Solutions 2015 AP FRQ

Thoughts about the questions:

#1. Part a was straightforward. Part b  will require students to construct a pretty sophisticated criterion for preferring either company. It will be interesting to see how “convincing” students’ arguments need to be.

#2. A great, simple question that will require precise communication of how confidence intervals work.  I like how students must explain  why a lack of evidence for  claim does not imply evidence that its negation is true.

#3.  This should, hopefully, be a slam dunk for kids. This is a good indicator of whether your students are understanding the formulas you use, or simply mimicking things that were done in previous problems.

#4. A straight up inference test for the difference in two population proportions.  I anticipate students not being specific enough in stating that volunteers were randomly assigned to treatments. 

#5.  Again a great litmus test to see if students understand the tools they use. This seems almost too simple for  #5.

#6. I think that this was a great, challenging problem. It’s a great problem to use in teaching sampling distributions in the future. It requires students to consider the distribution of a population, the distribution from a sample from that population, and  the distribution of the sampling distribution of the sample means.  I especially like how the oft-ignored requirement of simple random sampling comes to the surface here.  I worry that too many students will overlook the questions posed and write something that is simplistic and irrelevant.

Posted in Uncategorized | 11 Comments

2015 AP Statistics questions released! Stay Tuned.

Hi colleagues,  The questions were just released. You can get them here!

Upon first glance, many of them seem very simple, but I can see that students will need a high level or precision in their language to give convincing, thorough responses.  #6 was accessible, but takes a lot of thinking about what you are seeing. I can see why some students might think it was “really easy.”  I worry that they may have read those questions too superficially.   But if the questions force students to read, write and think, it’s a good thing.  See you soon!

Posted in Uncategorized | Leave a comment

Stay Tuned: My attempts at 2015 AP Statistics Free Response solutions coming soon!

Hi Colleagues,

It’s time to dust off this blog!  It’s been a VERY busy year, and most of my work / correspondence has happened off-site.  But I am looking forward to reviving my blog this summer.

To get me off to a good start, I will continue my annual tradition. I will “walk the plank” and submit a set of responses to the free response section of the 2015 AP Statistics Test.

You can see what I did in previous years: here in 2014  and here in 2013 .

A few comments:

1.  I am NOT, in any way, claiming that these solutions are exemplary. or “what the college board expects.”  I am a teacher of AP Statistcs since 1997, and these are my version of “good ” solutions.

2.  My solutions will go up about 24 hours AFTER the College board officially releases the Free Respsonse questions to the public at AP Central’s Statistics Exam Page. 

3. Please ask questions, critique, make corrections, or suggest different, better, or more interesting responses. This is intended to start dialogue.

See you soon!

Posted in Uncategorized | 4 Comments

2014 FR questions, AP Statsitics Exam. MY REVISED first attempt at solutions.

Hi all: I just worked through the 2014 AP Statistics Free response questions, which are publicly available here. 

My attempts at solutions can be found here .  

Possible Free response solutions 2014 frq,  Second Draft!

Those were my first attempt.  Thanks to Corey Andreasen, Pat Humphrey and others who caught some errors!

Again, these are simply attempts at solutions, and they probably still have errors… so tear them apart! I invite corrections, critiques, questions, and commentary.

I look forward to the dialogue.

If they provide a starting point for further dialogue about the questions, then I have succeeded.

UPDATE: Thanks to Corey Andreasen for his on-point comments.

I agree with his critiques, but I also want to think more about 4a:  Is there more to a complete solution than simply “means are pulled up by unusually high incomes, and medians aren’t?”

Posted in Uncategorized | Tagged | 25 Comments

Stay Tuned: attempts at solutions, 2014 AP Statistics Free Response coming soon !

Hi all!

this Friday, about 180,000 students will take the AP Statistics exam.  Typically,  the College Board releases Free Response questions to the public 48 hours after the administration of the exam.  As soon as I can access the questions and work through the problems, I will post a first attempt at solutions for people to read, discuss, and critique.

Best of luck to your students, if you’re an AP Stats teacher!  Best of luck if you are taking the exam!

Posted in Uncategorized | Tagged , | 5 Comments

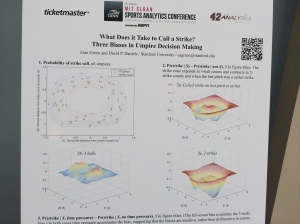
SSAC 14: What does it take to call a strike?

Difference between P(strike|S) and P(Strike|not S) for four different counts in baseball

Difference between P(strike|S) and P(Strike|not S) for four different counts in baseball

Have you ever thought that umpires are a bit too willing to call strikes when the count is 3-0?  Or, perhaps, you’ve noticed that umpires rarely call strikes when the count is 0-2?  In this very clear paper,  Etan Green and David Daniels  from Stanford University use Pitch f/x data to answer questions about how the  count (number of balls and strikes against a batter) help predict the chances that an umpire calls a ball/strike on the next pitch.

I was impressed with how the researchers wrote and presented so that everybody can understand their work.  This paper is easy to understand and share with students in high-school, in my opinion.  It simply takes a baseline understanding of the rules of baseball, basic probability ideas, and reading three-dimensional graphs.   

How are umpires biased?

  •  3 balls:   P(called strike) rises by about 10 per
    centage points above what happens overall.
  • 2 strikes:  P (called strike)  reduces by as much as 20 percentage points below what happens overall.
  • Last pitch called strike:  P (strike) reduced by  as much as 15 percentage points.

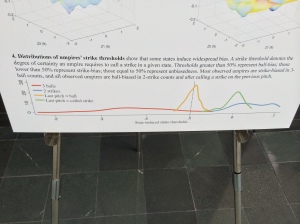
Is this isolated to a subset of umpires?  

Let’s look at the 50% contour line of calling

a strike overall, When looking at pitches after 2 strikes,  this contour contracts.  The area between these contours is called a “band of reversal:”  We found  a lack of bias emerging for pitches called after a ball.  But the ENTIRE distribution of strike thresholds is above zero for pitches after two strikes.  IN short, EVERY UMPIRE IS BIASED.

IMG_4145

Every umpire shows bias for certain ball counts.

Posted in Uncategorized | Tagged , , , , , | Leave a comment

SSAc 2014: Baseball Analytics: The Next Frontier

I chose to attend this because it featured Nate Silver.  I am anxiously awaiting the new fivethiryeight.com, and hoped that some spoilers/ previews would leak out form the conversation: No dice.

This was one of the only sports panels I attended this year: not enough interesting information gets shared. It’s interesting to see high-profile people on the same stage together. It’s also cool to hear top players answer the same question from different viewpoints. But the content is rich on sound bytes and light on substance for my taste.

Here’s my rough account:

Moderator:   Brian Kenny, ESPN
Vince Gennaro, President, SABR
Jeff Luhnow, GM, Houston Astros
Rob Nyer, FoxSports.com
Bill Squadron, Bloomberg Sports,
Nate Silver, Statistician, Author, Founder of  fivethiryeight.com,

BK:  Vince, There seems to be a disconnect in the amount of info out there, and how much gets transferred into the field. Where are we?

VG;  There’s work to do.  Translating to the field has to do with the lack of organizational alignment, that is, the analysts are not considering all of the stakeholders. One opportunity:  vertical alignment for a team, getting all the parts working, is key.

BS:  Every club has embraced to some degree.  Consider the Bloomberg System, some are big on using it, others pieces, but a long way to go. Many are simply using Lotus Notes or Excel spreadsheets to gat answers.

BK:  It’s football lagging, according to you. Where is baseball?

NS:  There’s new types of data… so “who’s ahead” is a moving target.  I am more of an optimist: Pitch f/x data, visual tracking, etc. There’s  lots there to use and grow from.

RN:  The Pirates are a good example: They saved a lot of runs b/c of buy-in from coaching staff and maganers. The coaches and managers had to be convinced. That’s one example of what we’re talking about. People don’t realize that what we are sharing makes sense. It’s a matter of time when almost all of the teams are using analytics more.

JL:  Baseball is in great shape.  The analysts don’t recognize all the factors going into decisions on the field.  Even a well aligned club, in the best of situations runs into implementation challenges. sometimes the outcome is not what you want when the outcome is right. But you’re not playing 10,000 times. You’re dealing with humans. Sometimes analysts don’t consider all the factors that truly matter. It’s a challenge, but we’ve progressed.  TLV DATA, radar data, etc. There’s so much out there. It shows what we don’t know…

BK: Jeff, has your organizational structure changed?

JL: No;  we have a well intergrated structure. Our five analysts are in the clubhouse all the time.

BK:  what’s a competitive advantage out there to grab onto?

RN:  The batters hadn’t tried to take advantage of defensive shifting.  The game has become a power game (more HRs). On the pitching side for sure.  Can the hitters adjust? Can hitters do anything?  Maybe they could make adjustments, bunt against the defensive shifts?

BS:  If so, it’s about focus. Not a silver bullet.  We have more data coming in (defensive, biometric, etc.). You need a way to filter out the noise. If you don’t you’ll miss opportunities. I would say that really the advantages come form having the right focus and the people having fast efficient processes.

NS: I think that player health from game to game is an opportunity.  A healthy team is probably a wild card contender on that basis alone.  The reward for a healthy team is very high.  The notion of positional versatility is underdeveloped.  More ability to shift around  when people get hurt. The Indians and the A’s are great at this.

VG: Nate is right: health is the next frontier.  We know so little about helping players perform at maximum capacity.  Not just injury prevention, but simple stuff like sleep and nutrition. How do we encourage players to get the rest they need while traveling?  Also, how do you take this and turn in into teaching tools for 16 year old in the Dominican Republic?  We evaluate to rank and forecast who will do well, but how do we turn a person around?   We’re seeing an increasing interest in data collection at all levels.  We’re trying to get into our system data from all levels, to help find potential.

Big Picture:  What’s next?

JL:   10 years ago, we had only 2% of the amount of data we have today.  Radar, video, hundreds of thousands of pitches thrown a year, 15 measures on each pitch. It’s so critical to ask the right strategic questions.

BS:  Best tools are always important.  With any new technology, it takes time to develop. Good decisions about structuring organization. More info coming out of tracking systems to analyze a player’s defensive skills.  So two big ares: HEALTH, and DEFENSE metrics.

BK:  Jeff: The Cardinals have a roster with a bunch of line-drive hitters…  not an accident?  Is that where we’re at?

BS:  We’re not putting run expectancies on vectors of hits. Player evaluation components are pretty advanced. Doppler Radar to measure the spin axis of a ball.  Going into DivI and Minors probably pitch f/x in every NCAA-D1 place in the country.

JL  We can now develop an individual park factor for every player in baseball.  The way they play can be customized.

NS:  Pitching has caught up to hitting. As an observer, it seems now that the clubs have pulled pretty far ahead and recruited lots of the stat geeks. I think that outsiders still needed to help all teams grow and improve.

RN:  Reaction data to balls now has objective measurements. That’s new.  There’s still a long way to go.

BK:  Is it now very proprietary?  Who is able to use this and not tell anyone?

JL:  you bet. we want a proprietary edge, but we rely on the outsiders that write/ analyze for all 30 clubs.  Some club not so much because hiring them and integrating the analysts in takes time and work.

BS:  You can build an entire system within, but the moving targets  – best to work with those who do this professionally. 27 of 30 MLB teams use our system.

BK:  Red Sox:  trying to find guys with good chemistry.

??: no clear correlation between being nice and being a good teammate.  Porter’s synergistic chemistry lab. “you know it when you see it.”  Creating it is hard.  Leaders must evolve , followers must follow.  Leadership is organic. To engineer chemistry? That’s difficult.

JL : It’s palpable and tangible and understanding it:  It’s a huge thing to study.

RN:  I remember how volatile chemistry is: so dependent on winning and losing.  The A’s and Yankees were constantly fighting in the clubhouse, but winning pennants. Putting a finger on it is tough. “sure it’s important.” But dying to pick guys based on that?  The Red Sox has great chemistry, but will they win 97 games?

BS:  Yep, important and difficult to put a finger on.  If we create a workflow to finish tasks more quickly,  that’s a good thing for chemistry.

NS:  Sure yeah.  I think less in baseball than in football, but hard to measure.  a randomized controlled trial?  But chemistry can also excuse some shitty decisions, poor ways to analyze the value of a player in my view.

BK:  A rise in 3-2 outcomes. More strikeouts. Boring. A problem?

RN:  SO’s exciting when a star is on the plate. For a more humdrum starter, I’m not sure it’s interesting.  Trying to separate my aesthetic reaction. The variety of experiences is what makes it outcomes. But runs and walk not changing. SO’s are rising steadily. Ruled would need to be changed, this means players need to be consulted – they are conservative.  There is a feeling that the pace should quicken.

JL:   Pitching today is extraordinary.  5-6 guys throwing 95 MPH.  People love pitchers’ duels.

BS:  Something about place of play:  I do think that fans are digging deeper into the game, getting into the data/ analytics side more. we’re able to project in real time  how P(on-base) in THIS situation is changing ptch by pitch.  I’d hesitate to change some of those core things. More to bring out via visualization.  Rule change,s not so much.

NS;  Yeah-  tings revert to the mean.  Lots of power pitching. Maybe some hitters can exploit this?  Innovation can probably lead to a change.  It’s a tangibly duller pace of play than, say, football.

BK:  You are incentivized to moves that lead to the 3-2 outcome.

JL:  There will be someone who breaks out on the hitting side with a very low SO rate.

BK: Player projections:  Where are we?  Nate?

NS:  PECOTA, 11 years ago. Now, I’d start from scratch with all the new data and enough years to see what is predictive. Now we can more directly measure skills, not proxies of skills.  A half year to innovate well to use everything we have now.  Projections are improving, but smart quants getting hired by teams.  Not as much on the public side.

BS:  We see the fantasy side increase – our predictive formulas are great.  It’s a lot of fun, the fun part of what we do.

VG:  More focus on batted ball performance,  incorporating the ball park.

RN: I haven’t seen anyone to consistently beat the over/unders.

JL:  We’re trying to win games. We have a great projection system.  They are giving us really valuable info and blending it in with out projection system to improve the system.  Using the scouts helps, The fundamentals there, but with the new data, a whole new ballgame.

Posted in Uncategorized | Tagged , , , | Leave a comment

SSAC 14: 10,000 Hours vs. The Sports Gene: A conversation with Malcolm Gladwell and David Epstein

This debate/ panel discussion was one of the highlights of the conference for me. Both were wickedly bright, thoughtful authors who fleshed out compelling arguments for their side.  As many readers of Malcolm Gladwell know, he is known best for provoking readers to consider unconventional arguments (rather than arguing convincingly) in his books. He owned this  reputation quite proudly during the conversation, as you shall read.

Learn about Malcolm Gladwell Here.

Learn about David Epstein Here.

What’s responsible for extraordinary athletics performance?  10,000 hours, or “the sports gene?” Authors Malcolm Gladwell and David Epstein debate and discuss the research around nature, nurture, and elite performance across different disciplines.

PS: this is a quick account as they were speaking.  Forgive any errors or mistakes in this account.

MG:  Let me try to describe David’s argument, and then he’ll describe my argument.

The Sports Gene (I liked it, read it) is making two arguments:

1. Genetic Variability:  what we observe at the elite level is the spectacle of human variability in action.  Elites are almost invariably genetically different than the norm.

2. A structural understanding of athletic excellence: You situate E african running prowess in context of their geography and wnthropoloy as well as their genetics to understand their dominance.

I believe that these arguments are interesting to explore, and their popularity illustrate how our standard descriptions or excellence are wanting.  We are typically thinking on the nurtre, not the nature side, which is why the book was compelling.

DE:  What MG has said in Outliers differs than the public perception.  The  prevailing (and inaccurate) idea: 10,000 hrs is both necessary and sufficient to gain elite skill.  That’s not MG; the “rule” is a principle. Once pre-screened, after that level, practice is the difference. The threshold hypothesis: above a certain threshold, stable abilities/ talent no longer distinguish people to the same extent as practice does. Your version of this is the 10,000 hour hypothesis.

MG:  Here’s what’s confusing: the idea came originally from a paper by Simon/Chasen – the chess context. What distinguishes an elite player?  Because of an extraordinarily large # scenarios seen, they can “chunk” things in larger pieces.  Gretzky can make huge chunks because he had processed so much in the past. You have to play for a large amount of time before you can do this. They guess at least 10,000 hours of exposure. Anders Ericsson dispenses the idea of “threshold,” and expands/ stretches it:  it’s all practice.

DE:  But the chess players ranged from 14K to 50K hours:  10,000 was an average of individual differences.  What is the degree of variability  among  elite players?

MG: We can quibble about this threshold number, but … do we really care about chess?

DE; I argue that focusing on super-elites is a bad place to start. Such a restriction of the data to an extreme degree. If you study basketball skill and restrict your dependent variable to just hyper-elite basketball skill, you can get a negative correlation between basketball skills and height!  Bizarre results emerge with such restriction. If you extrapolate back to childhood, many of the best players practiced less in the early years!

MG:  Let’s step back: Ericsson says that deliberate practice can reach the elite level with enough time.  The middle ground is what, I think,  I occupy: some baseline of talent is required, and practice. We can move the bar over: Where is the optimal practice/talent division?  Maybe Eric is right for some activities. For example,  start will college graduates: perhaps the overwhelming majority could be better than average cardiac surgeons with sufficient commitment and practice. I don’t think there’s a magical talent in that field.

DE:  Ok, but what’s the proof of that?  What’s the evidence?  If you look at doctorates in general… Looking at mathematically precocious youth,  the top quartile of the top 1% at age 13 have grown up to have many more doctorates than the rest of the top 1%.

MG:  I would say that there are a series of relatively complex psychomotor tasks that nearly all of us can do successfully. Driving, for example. We operate that ALL can learn to drive safely, Society doesn’t even ask:  we have enormous confidence of some tasks by simply being motivated and putting in the time. Is cardiac surgery that much harder than driving? Not really. There are restrictions and rules, but if you can drive a car, then you can probably become a cardiac surgeon.  I give a charitable defense of Ericsson: the realm of conquerable challenges is larger than we think.

DE  A good point, however, Ericsson goes MUCH further. He’s a bit extreme. Ackerman: the more open a task (unlimited the moves), the greater the differences become with training.  Is cardiac surgery open/ closed?

MG:  I’d argue it’s closed. Then add to that another variable: motivation. Our definition of “motivation” is interesting. Is motivation to practice hard-wired, or something entirely environmental? I read that as a 3 year old, Wayne Gretzky would be transfixed at a game, then burst into tears when the game was over. The game was so satisfying on a deep emotional level and fit his imagination so deeply, I surmise that it must be innate in some way – Gretzky has a weird “fit” of his imagination with hockey: Like classical music fits a composer’s imagination:  Do we have an incomplete understanding of motivation?

DE:  Very possibly. I’m interviewing a 55 year old triathlete:  She cannot sit still.  Literally.  She must be moving.

MG:  Suppose you put a group of people with a mild genetic predisposition to run quickly, and put them in Jamaica:  the motivation to run is intense: more so than whatever genetic traits can predict, I think.

DE: Prodigies in math, art, etc… They have associated abilities outside their world – other things determine where they go in their field. Clearly an interaction effect.

MG: The classic study on mathematically precious youth: you start with roughly equal numbers of males and females, and females drop out. Here’s a thought: maybe the boys define what they like at what they are good at, but girls don’t think that way. They like what they like, but being good is not the key thing. A benign explanation for long term differences, but an intriguing one: A fascinating interaction / environmental nullification of an environmental trait. One may cancel out excellence for relatively mundane organizing principles.

DE:  A question: What is your description of the 10,000 hour rule?

MG:  You never know what people will be drawn to. … I had no clue that the 10,000 hour rule would catch on: I was trying to make appoint about social support. The thesis of outliers (and the 10,000 hour rule)?  success in a group project.  Once you get that elite success takes a LOT of support and work, the idea is obvious. You get the idea why there are no poor grandmasters. You can’t do it without a lot of social support.  Bill Joy, the extraordinary programmer, told me that the list of things to become an elite programmer was huge.  So I don’t know how you put in the 10,000 hours without tremendous social support.

DE: I give you a hard time, because you gave me a hard time about similar inconsistencies.

MG:  Am I inconsistent? absolutely!  I love to take an observation and call it a law!  It gets attention! Consider  “the exception that proves the rule.”  It’s just a fabulous cop-out.  A cover your ass way to justify all logical inconsistencies in one’s thinking… what’s not to love?

DE:  Your idea that these things take more practice than people think…sure. But what are you really saying other than “After screening, practice helps?”  That’s the most watered-down version of your argument: what more are you arguing?

MG  I’d add:  Absent practicing, at some level you will guarantee that you don’t progress.  Classical music is a great example:  Of the top 75 pieces, only three were composed by a person with no less  than 10,000 hours of work.  Excellence cannot happen without putting in the time. In a day where we celebrate flashes in the pan, it’s a huge point to say.  One problem: elite people systematically underestimate the amount they practice. Self-reported work time is notoriously biased in underestimating Chris Chadaway – one of the great English runners: Still maintained that he never trained.

DE:  I asked him about the lack of measurements of variance in Ericsson’s 10,000 study:  What was the variance?  He said, reporters weren’t good at estimating.  But he never included a measure of variability.  To your composer point: let’s talk about Mozart.  It seems that composers always test high on working memory.

MG: Mozart’s early compositions were not good – he started getting good after 10-11 years of composing. The path towards genius, when steep, but the product of the prodigy is not on par with those of the mature practitioner.  Let’s talk about thresholds.  I had in my book: The idea of the “flat maximum” in psychometrics. At the top of the distribution, the value of the metric begins to lose value. IQ is hugely predictive around the mean, (95 – 105 matters) , but at the edges knowing the difference between 140 or 175 is not predictive. The interesting predictor is their effort level. Especially b/c creativity diverges greatly from intelligence at the high IQ ends. So the admission standards at the elite level are BULLSHIT.  The great suggestion: the only fair way is to have a general cutoff and then a lottery.

DE:  I don’t think it’s a true flat maximum: there’s a ceiling I think it looks like it curves UP  at the ends , but there are no tests for them.  I think the chances of getting  tenure in science and math is predicted.

MG: Those studies double count. Good at SAT is the same as “finishing doctorate” skills. The 690 kid at age 13 is demonstrating an abnormally high level of self-discipline and an abnormal affinity with measure of intelligence.  I don’t like that. Is their work any good? How about “number of citations on papers?”

DE:  Right now, two very long longitudinal studies would disagree. When you restrict the range of any sample, you would lose predictive power.

MG You miss the point:  It’s not just  people bumping up against the “cap.”  It measures only one of many traits that you need for elite excellence. When you see divergence between creativity and other measures of cognitive ability at the top, that should give you pause – are you measuring what you care about? Jensen:  at IQ=100 sure it works, but to find groundbreaking work at the elite level, we are interested in so many traits. Why are we in love with IQ or SAT as a proxy?

DE: Yeah… Let’s talk about sports, though OK? At some point you are standardizing both the traits and the

MG:  The NFL combine:  for 95% of the things they want to do, a 40YD dash time at the 40th percentile is probably fine. Then you can systematically apply that to all sorts of thresholds: the “don’t care” line where further achievement is meaningless.

DE: Big data flooding into sports. The combine sucks because the measures aren’t things you do in football.

MG: The fix for the combine is the same for college admisions.

Q:  Can teams use anthropological traits to find, perhaps breed players?

DE:  WE know a ton about body traits that work in sports. wingspan vs height ratio in NBA – 1.05/1 in NBA, but 1/1 in general pop.  Most NBA would qualify for Marfan syndrome.  Sports science is buzzing about the big bang of body types. Now we know what types work for each sport.  Will teams genetically test? No test for physiology, not genes: It’s probably better to assess the skills directly.  Maybe those predisposed for concussions or heart failure?

MG:  Andre Agassi and Steffi Graf’s kids in Vegas: there’s an experiment in genetics to see what happens?

Q:  Does the 10,000 rule explain the number of siblings in sports (the Mannings) ? 

MG:  I don’t think it extends to sports easily. One exception: playing QB . The chunking arguments of chess apply to quarterbacking, I think.  I would be intrigued to study that idea. Also maybe golf:  If  you have siblings who play non-stop, absolutely. Especialy if you are competitive with an engaged parent. As the cognitive complexity of certain sports increase, then I think the value of atypical support increases as well.

DE:  As it’s more complex, the more hours you need to put in.

Q:  What about in random environments with unclear outcomes?  

DE:  One of the revolutions in exercise genetics: I may need 3 tylenols, another needs 1.  What’s the optimal exercise for that athlete?

MG: Wouldn’t that be great to do at the NFL combine:  the susceptibility to training? How you respond to the kinds of efforts teams need in the next few years? It’s what we get at when we talk about “upside:” someone trying to understand an athlete’s sensitivity to future training.  Or is there already a threshold?

DE:  I think there’s not a baseline.

Q: Can motivation be learned, or is it innate? 

MG:  Psychologists would sat that notation is most environmentally determined. You see clusters of  excellence in surprising area – Dominican shortstops, Dutch speed skaters, Social values impact to motivation, I think are enormous:  The degrees that certain ethnicities are overrepresented in medical fields . Overrepresentation by 5x , 6x:  Cultural expectations/

DE: I find training groups to be incredibly motivating.

Q:  Can talent drop off due to fragmentation of student time?   

DE: I don’t think do:  chess prodigies are happening earlier and earlier. I don’t think there’s fragmentation, but rather a trend toward hyper specialization, and many people think that it’s not the best way for kids to succeed.  More typical:  Rodger Federer, who dabbled.  Some evidence that the elites were not practicing one skill a lot, because the truly elite are “sampling” what fits their personal self the best- they have a choice.

MG:  We both ran competitively : success at age 13 is not a great predictor of success at age 21. Burnout. The idea of burnout:  have we underestimated this as a consequence of hyper specialization.

DE: For Girls who are early talents in tennis, a major burnout rate.

MG: The trend towards hyper specialization has a perverse end: To develop an elite corps you want huge pool of potential. What happens with hyper is that you diminish the pool at the outset. You direct your kids out of such things. Shouldn’t we expect out achievement to worsen with this trend?  Would it make sense to ban certain kinds of national level sports below a certain age?

DE: One nationally ranked tennis/ hockey girl thinks you should ban  major travel times. The more you ban access, the lower the talent you get.  The model is to keep decent kids in – do disadvantage them so much to

MG: The Canadians fixed this: Just focus all of your attention on one sport!

Posted in Uncategorized | Tagged , , , , , , | 1 Comment

SSAC: Teaching the Next Generation of Sports Analysts

MY take on the session:  I was grateful that there was at least some interest in thinking about how to teach sports analytics. The field is extremely new in academia, and currently has no real “core:”  It’s a multidisciplinary field;  sports, statistics, operations research, business, and computer science are all involved.

This made me excited to learn that our course at the HS level is indeed cutting-edge. In many ways, the pioneers at the HS level have the opportunity to influence the way these courses are taught.

One of the biggest impediments to moving the field forward is the fact that the most interesting (visual tracking) data is owned by teams and businesses.  This means that any research from such places can’t be replicated or verified currently. An incentive for more open access is not yet available.  More sharing between universities, analytics businesses and sports teams is needed.

I’m also hopeful that Jeremy Abramson from USC because a potential contact: I’d love to share resources, ideas, and experiences in designing our courses.

Here’s a rough account of party of the conversation:

Jeremy Abramson , USC
Jeff Ohlmann, U Iowa Tippie College of Business
Ed Kaplan, Yale School of Management
Nils Rudi, INSEAD

Moderator : Mike Magazine, University of Cincinnati 

MM: I’ve believed in  doing this session for a long time.  We need it, and thus something we should teach.  I’ve taught courses on sports analytics and bracketology. What motivated you, and why is it important?

JA: #1: I love sports, and nobody else was doing this. Mine is an undergrad class to get them interested early in the field.

JO:  I was washed as a larger initiative to engage our students. a 1 hour class, no prerequisites. Ultimate goal: to turn the students on to the discipline.

NR:  Lots of demand from students, and it’s such a great field to teach modeling.

EK:  Like Nils, I am an operations researcher, and kids don’t love financial analysis or marketing or policy:  How can we get more people in modeling? Sports was a perfect hook.  3 years now, 50 MBA students.

MM: What do you want to achieve? What are the takeaways for students who won’t go into sports analytics?  

EK: Many work for sports leagues.  Dependent on the technical training of the students. Techniques in the research track are not accessible with less training. But the focus is on the questions: to teach them something about the game they wouldn’t understand otherwise. Example: individual metrics are common, but sometimes poorly used by management: The course is a nice laboratory to think about the value of this.

JA: First, that it’s real, not just “geeking out.”  Real impact on the field and the organization’s bottom line.  A technical background certainly helps a lot.  The value of a technical background is very helpful in the sports industry.

JO:  Basic familiar examples: Belicheck’s going for it on 4th down.  How do you separate the BS from accurate claims / accurate statements?  Condiitonal probability: basic statistical concepts.  The sports vehicle allows them to think about hard problems. Sports helps kids bang their heads against such a hard problem more.

MM:  Yes, Belicheck was blasted for his 4th down choices, but the decision was right. Plus the right decisions don’t mean the best outcomes every time. To distinguish that is a valuable takeaway.

NR: We have a very international group. Students learn how important it is to ask the right question, collect data, and communicate your results to stakeholders and audience.  Also, how important it is to base conclusions not on outcomes. So many people try to explain the causalities of luck.  It provides a framework to disentangle luck from signal.

EK: Students do projects in the class: they can run with concepts and applications in places I don’t understand. One of my favorites: a group evaluated players in cricket using the techniques.  They found that the salaries and compared it to “run valued added” state. They found that the ratio of pay/runs created that all the Indian National were highly over-valued.  The non-nationals were highly under-valued.

Posted in Uncategorized | Tagged , , , , , , | Leave a comment

SSAC: The Hot hand: A new approach to an old “fallacy.”

So thanks to my wonderful school, I was given another opportunity to attend the MIT / Sloan Sports Analytics Conference.  This year, I am spending most of the first day attending research papers. Whle the panel discussions definitely have some super-star names (I did see Andrew Luck),  the real substance of the conference is in the research sessions.

Here’s my first of a series of posts on the research paper sessions .  After these posts, I will summarize my experience  at the conference, and how it overlaps with my Sports Research course that’s currently going on.

Challenging the  “Myth” of the Hot Hand

Three recent graduates of Harvard University (Andrew Bockocksy, John Ezekowitz, Carolyn Stein) took a new perspective on the long-held belief that the  Hot Hand theory is a myth.  and challenges the previously held assumptions about “shots being taken at random”  in the NBA when a player makes previous shots.  Their paper can be found here.

A rough account of the presentation (with Q/A) is here.

1. Intro: Framing the investigation

A player has made several of his past shots. Is (s)he more likely to make the next shot?   Are shots independent events?

Tversky et al:  No evidence for it,  based on looking at previous shots.  The conditional probability of making a shot did not change based on different prior performances.  They looked at streak lengths, and found it consistent with the assumption of independence.

This became the conventional wisdom for a while in the media (Larry Summers, David Brooks) , an example of “data exposing human biases.

But Here’s the thing:  The  researchers took issue with the key assumption in the paper is questionable: that players randomly select their shots…  Wouldn’t a potentially “hot” player take riskier shots?  So they asked… Do players try harder shots when they have make a series of shots? 

2. Defining Hotness: 

They took data from NBA Roster,  NBA Expanded Play-by-Play,  SportVu optical tracking, and SPoRTVU Play-by-Play optical tracking to create a shot log. For each shot, they recorded the time, shot location, shot type, and location of all 10 players on the short.

With this, they were able crete a linear regression model  to estimate each shot’s difficulty based on game situations, shot situation (including distance from basket), defense, and individual player.

This metric helped them create a metric called “Complex heat.” What’s that? Let’s call simple heat a player’s basic   shooting percentage over their past 4 shots.

From that, we can define  Complex Heat:   (actual shooting percentage) – (expected shooting percentage, based on the  estimated shot difficulty of those shots). A positive value is for complex heat is a  “hot performance.”  Complex heat is a better measure of “hotness,”   because simple heat overvalues easy shots.

3. How does hotness change a player? 

Do players change their behavior, based on a perceived hot hand?  More specifically,

  • Do they take shots from further away?
  • Do defenders defend hot players more closely?
  • Are how players more likely to take their team’s next shot?
  • Does overall shot difficulty increase with heat?

Example:  Ty lawson pulls up for a “heat check”  3 pointer, after making 3 better-percentage shots in a row.  He makes it!  He takes his 5th shot, a “leaner ( a closely contested shot with high difficulty”

Results:

  • Shot Distances:  When hot, average shot distance increases by 6.8 inches  (4.5%)
  • Defender Distance: Defenders are, on average, 0.5 in  closer. (1.0%)
  • P(take next shot):  goes up when players are “hot.”   (7.6% increase)

 Bottom line:  “hot” players take harder shots… AND… players who are hot are more likely to make their next shot, when controlling for their next shot’s difficulty.

So there seems to be some evidence that players do indeed get “hot,” but because they take harder shots, the two effects may be “canceling” each other out.

The BIG  takeaway:  There’s probably something legit behind Coaches’ and players’ insistence that players sometimes get into a hot zone. For sure, this analysis came listening to the thoughts and explanations of players  and coaches.   

Unanswered questions:  

  • Should players be going for harder shots?  Is this choice smart decision strategically for their team, or are they missing a chance to pass off to a higher percentage situation?

Audience Questions: 

Q:  Did you differentiate by position?

A:  Not in testing for the hot hand.  A consideration yes may get tricky if you are isolating ju

Q: Complex heat: How do you control for which of the five shots were made ? 

A: If you make a hard shot, your “value added” is higher… It shouldn’t matter:  maikng one really hard shot

Q:  Are FT’s included?

A   No, and that’s a great point.  (BTW,  the male presenter has a habit of interrupting his female colleague – and the reverse is not happening.  This is really evident.) 

Q:  Was your work separated by teams? 

A: Nope. Another thing to look at. Do certain coaches “let players be?”

Q: Did you look at times when players resisted taking harder shots ? 

A:  We’re  controlling for difficulty, so that’s happening:  It’s embedded in the complex heat measurement.

Posted in Uncategorized | Tagged , , | Leave a comment

Statistics, Sports and School: It’s On!

Hi all:

Well, “Statistics, Sports and School” is underway. This post is an place to learn more about the course without me jabbering on too long.  Here are some useful files.

Syllabus for SSS 2013_2014
The student Blog for “Statistics Sports and School at HW”.  Go check out some of the early student Work.

Stay tuned for more cool things soon!

Posted in Uncategorized | Leave a comment