SSS: Testing for a real Home Field Advantage

So as I continue doing research for my course,  I decided to jump into the vast database at http://www.pro-football-reference.com  and answer a very simple question:

Is there convincing evidence that the Denver Broncos have an advantage when playing at their home stadium, Invesco Sports Authority Field at Mile High?  (p.s. … Why can’t they just call it Mile High Stadium?
You can access the data file here.

Bottom Line?  Yup:

They won 63% of their games at home and 46.5% of their games on the road.

Could this have happened by chance?  Again , I ran a simulation in Fathom to help answer my question. How did the simulation turn out?

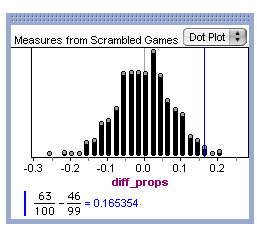
1000 simulations of 199 games, where no home field advantage exists. We recorded difference in home and away win rates over 199 games. a 16.5 percentage point advantage for the home team doesn't occur very often by luck.

1000 simulations of 199 games, where no home field advantage exists. We recorded difference in home and away win rates, and plotted what actually happened at Invesco Field from 2001-2012. A 16.5 percentage point advantage for the home team doesn’t occur very often by luck.

This difference is unlikely to occur by luck if there is no real home field advantage (<2% of the time could the Broncos have been so lucky without a real home field Advantage).

Next question:  What about Mile High Stadium (the original stadium)? How does the advantage at Invesco compare to the one at Mile High?  

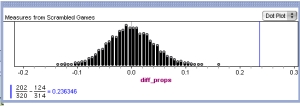
Before 2001, when Denver was at the Original Mile High Stadium, Denver’s home-filed win rate was 202/320 = 0.637.   Their away-field rate was 124/314 = 0.394.  This difference of 23.7 percentage points seems HUGE.  How likely could such a big difference happen by chance with if home-field advantage doesn’t exist?

The difference in win rates between home and away games (.631-.394 = .236) is plotted against what might happen by chance over 634 games  if no home field advantage exists.

The difference in win rates between home and away games (.631-.394 = .236) is plotted against what might happen by chance over 634 games if no home field advantage exists.

Yeah: There’s CLEAR evidence that there was a home-field advantage at Mile High stadium as well.

Posted in Uncategorized | Leave a comment

SSS Card Tossing Experiment, Part 2: is the evidence convincing?

So time to analyze some results: Do I have convincing evidence that my ability to toss playing cards into a bowl is better with my left hand than my right hand? 

Let’s look at my actual performance:

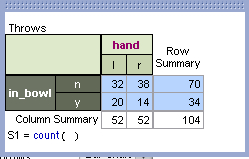
Here is my two way table of card tossing results

Here is my two way table of card tossing results

Here is a bar chart of my card tossing results. My left hand got six more in than my right hand.

Here is a bar chart of my card tossing results. My left hand got six more cards in the bowl in than my right hand did.

I had an overall  success rate of 34/104, about 32.7%. For my left hand, my success rate was 20/52 (about 38.4%). for my right hand, 14/52 (about 26.9%.)  That’s over an 11% percentage-point difference.  If this were a presidential election, this big a difference would be considered a landslide.

Question I would pose to students: 

Why were my results so different?  What could have caused it?   

Remember from my post in part 1  that the hand I used was determined my random assignment (picking a red card or a black card).  This evens out the impact any other factors that may determine whether the card went in the bowl or not  (wind, distraction, a badly planned throw, a weird playing card).

Eventually, I would hope for students to settle into one of two competing explanations:

Explanation 1:    My ability to throw cards is no better with my left hand than with my right hand, and the results were due to chance, or luck.

Explanation 2:  I really am a better card thrower with my left hand, and the data reflect this.

I ran a simulation to determine if I can rule out explanation #1.  How can we do this?  

(I’d give students about 10 minutes to discuss a good simulation here. Hopefully they would converge onto something like this).

1.   We know that 34 cards went in the bowl, and 70 did not. I could  take two decks of cards, shuffle them thoroughly together, and deal out 34 cards – those will be my throws that “went in the bowl.”

2. I now want to assume that explanation 1 is true, and see what could plausibly happen by chance. How do I simulate this?

 I will look at the color of each of the 34 “in the bowl” cards I dealt out.  Red = Right Hand,  Black – Left Hand.  Because the cards are shuffled thoroughly, my left and right hands are equally able to “get in the bowl.”

I’ll record a statistic:  “# left cards in the bowl” – “# right cards in the bowl.”  For example, if, in my simulation,  I get 17 red (right) cards and 15 black (left) cards Then my statistic will be:

15-17 = -2

3.  I wil repeat this process, and record  “# left cards in the bowl” – “# right cards in the bowl.” over and over, until I build up a sampling distribution for my statistic.  I can do this by generating a dot plot of results by hand.

4. I will look back and my real data from the actual experiment.  I will compare my value  “# lefties in” – “# righties in”   to the range of plausible values in my sampling distribution.  what could plausibly happen by chance.

So how did it go?   Here’s a dot plot of 1000 runs of the simulation:

In the actual experiment I had 6 more lefty successes than righty successes. If I were "completely ambidextrous" in my ability, a +6 or higher can happen by chance about 14% of the time (about 1 in 7 simulations)

In the actual experiment I had 6 more lefty successes than righty successes. If I were “completely ambidextrous” in my ability, a +6 or higher can happen by chance about 14% of the time (about 1 in 7 simulations)

So what do you think?  Is my “+6”  convincing evidence? How big a difference between my lefty and righty results would be convincing?

Most people would not be convinced that I’m a better card tosser with my left hand.  The results in the actual experiment are not that unusual: something as/more unusual happens about 14% of the time by random chance.

Here is a video of how I ran this simulation in Fathom.

You can also run a simulation like this in a great Website called StatKey.   Here’s how the results turned out there:

Again, based in 1000 simulations, a “+6” or higher occurred about 15% of the time by chance.

So no convincing evidence my left hand is better than my right hand throwing cards.

How could I get more convincing evidence in my next experiment?   

Posted in Uncategorized | Leave a comment

SSS Research: Card Flipping experiment, part 1

One of the important parts of my “Statistics Sports and School (SSS)” course will involve students creating a research question that can be answered with data collection, and designing a plan to properly collect data.  Anybody who has taught statistics understands the challenges of having kids narrow down their wonders to a question that can be answered with the limited amount of time, resources, focus, and energy available to them.

To put myself in their shoes, I designed my first mini experiments with a tinge of “sportiness” to them. Hopefully future questions will involve me doing something where I don’t sit on my ass.

Here was my first research question: Can I toss individual playing cards into a bowl (from about 5-6 feet away) better with my dominant(left) hand than my non-dominant (right) hand?  

While my husband was watching some cable movie entitled "Revenge of Mordor," or something  like that, I decided to mess up the living room.

While my husband was watching some movie entitled “Revenge of Mordor,” or something like that, I decided to mess up the living room.

I challenged myself to come up with a question in about 20 minutes. I liked this one because:

  • The question is authentic ( I think I’d be better with my left hand, but I’m not totally sure: I throw frisbee better with my right hand, and tossing cards is like throwing a frisbee. …but is that the same type of dexterity?)
  • The question involves some reasonable complexity (lots of variables impact whether a card goes in: practice, mild winds, degree of focus, fatigue, distance to the target)
  • The question required systematic, but achievable data collection (I messed this experiment up about three times before executing all the steps and recording data with a reasonable degree of consistency)
  • The question allowed for many approaches to analyze the problem
  • The question reveals more questions to pursue
  • The plan to collect data could be executed in a reasonable about of time (about 2 hours, including screw-ups)

Here was my protocol:

1. I took a deck of plastic poker cards (plastic ones bend less, and are less likely to crease, tear, or be distorted my normal weak than paper ones).

2. I shuffled the 52 cards to determine which hand would throw the card in each trial.  Black = left hand.  Red = right hand.

3.  I sat down on the couch with my deck, and threw each card, aiming for a large, deep salad bowl with a diameter of about 14 inches.

4. I recorded the following variables after each trial:

X1: the hand I used (l = left (dominant) hand. r = right(non dominant) hand.
X2: Did the card land in the bowl (y=yes, n=no)
X3: trial number (1 = first throw, 2 = 2nd throw, etc…)
X4: round number (1 = first round of 52 cards, 2= 2nd round of 52 cards. After tossing the entire deck once, I had to collect all the cards, check my work, reshuffle, and re-seat myself after the first set of 52 throws was completed. I wanted to account for the fact that conditions affecting my success rate might be different in the two rounds.

Here is an Excel File of the card flipping experiment. 

Here is a Google Docs File of the card flipping experiment.

If you convert this into a .csv file, you can easily import this into Fathom, or your favorite tool for data analysis.  I’m not a huge fan of Excel for statistical analysis, but hey, knock yourself out.

Challenge to the reader:  What can you do with this?  

Maybe the folks studying data and Statistics at PCMI  would be interested in playing with this data.

Are you convinced that this evidence shows that  I am a more accurate card thrower with my left hand than with my right hand?  Support with the existing data, please. 

I’d love to hear what you would do to answer this question with my data. I’d also like to know what other questions/ wonders that crop up.

More on my analysis in a bit.

… of course, to increase your accuracy, you can always do this. 

Posted in Uncategorized | Tagged , , , , , , , , , | 5 Comments

Statistics, Sports and School (SSS): “The Choke”

It’s time for the designing process for “SSS” to begin.

I’ve been both excited and scared to start constructing a course in “sports research”  since it got approved about six months ago.  Since then, I’ve been attending conferences on undergraduate research, teaching statistical reasoning through activities, learning a lot about the sports analytics / sports medicine industry, and promoting the course to colleagues and sports professionals.  Now the grunt work begins.

Big Task 1: Select tasks to achieve the following goals for students:
1. Feel more comfortable and rewarded for asking questions, wondering, and suspecting without “knowing”  or “telling,”
2. Recognize the power of designing probability  simulations to to answer some questions in sports.
3. Better understand how to design a plan to answer a question analytically.

My main resource for the statistics part of the course will be Josh Tabor’s and Chris Franklin’s wonderful book, Statistical Reasoning in Sports.  The book prefaces each new statistical technique with a very plausible question a student could ask. Here’s their first question:  Did LeBron James choke in the 2008 NBA Playoffs?  In other words, did LeBron James short-term performance in the 2008 NBA playoffs provide convincing evidence that his ability to make three pointers actually went down in the playoffs?

Here are the facts:
1.  In the regular season,  former NBA Cleveland Cavalier LeBron James made 113 of 359 three pointers. This gives a good estimate of his ability to make three pointers during the regular season: about 31.5% .

2.  In the playoffs, his three-pointer performance was worse. He made only 18 of 70 three-point shots (25.7% made). Not great for LeBron.

What caused it?  two possible explanations:

1. LeBron’s ability to shoot 3s in the playoffs be the same as it was in the regular season, and this weaker performance fell within the plausible range of “bad luck” performances?
2. LeBron’s ability to shoot 3s was indeed lower (for some reason: not necessarily a lack of mental resilience). His weaker than average performance shows this.

Note: The careful and intentional use of ability and performance is being taken from Josh Tabor’s, who thoughtfully followed the example of stats education pioneer Jim Albert. 

Can we determine a way to rule out explanation #1?  

(PS – after LeBron’s performance in the 2013 NBA playoffs, this question seems positively disrespectful.  But more on that later).

A few questions I would prepare before investigating: 
1.  Suppose LeBron’s ability hasn’t changed. How many three pointers  out of 70 would we expect him to make? (Answer:  (0.315)(70) = about 22 out of 70.
2.  Would he get 22 out of 70 every time? Why not?
3. How about 21? 20? 19? 18? What’s “too low to get” by chance?

PS – This final  question is a surprisingly tough one for some students of statistical reasoning: Once they acknowledge that the average won’t necessarily happen, they then sometimes default to “anything can, and will happen.”  The binary yes-no logic form mathematics  is a bit too simplistic  to be useful in this context.  The interesting stuff is happening between these two extremes, the in between: What do your insides tell you?  What seems “too far off” in your own gut? 

The plan:  Run a simulation of 70 three-pointers, assuming LeBron’s ability was the same is in the regular season (His three-point percentage is 31.5%).  The Statistics Program Fathom is a wonderful tool for executing a simulation, but so are note cards, random number generators, spinners, and a variety of other low-tech, inexpensive tools.

If you don’t know about KeyPress’s statistics learning program called Fathom, then climb out from under your rock and get a copy.

Back to the task: Suppose I wanted to assume LeBron’s three pointer ability didn’t go down in the playoffs.  How could I see what possible performances (of 70 free throws) are plausible by sheer luck?

Questions I would prepare:  
1. How would I create a simulation of 70 free throw attempts?  What tools would I use:  Dice?  Coins?  Random numbers?  What “program,”  or “recipe”  would I need to follow in order to fairly simulate LeBron shooting 70 free throws?  Let’s make one up.
2. What would we look for at the end of the simulation?
3.  So how would we decide whether Lebron’s performance (18 out of 70)  is a “choke-worthy” performance?

lebron threes

Results of a simulation of 70 three pointers, assuming LeBron was as good at shooting 3s in the 2008 playoffs as he was in the 2008 regular season.

After the simulation was over,  I’d love for them to raise critical questions about the analysis. Some that came to my mind:

1.  Is it fair to assume that players should be performing in the playoffs as they did in the regular season? Aren’t playoff opponents, by design, better than the average team the Cavaliers played against in the regular season?
2.  Is it reasonable to assume that Lebron’s role on the team (whether he shoots 3s, plays closer to the boards, etc) is the same was it was during the regular season?

2. Does this lead to other questions/ claims to analyze? 

So that would be an in-class task.  The hope/ goal for my students is to find a similar question/wonder they could ask where they could run a similar simulation, but:

1. they come up with the idea in their own.
2. It benefits themselves, their curiosity, or the school in some way.

That’s the first day of work.  Of course this led me to about a thousand other pathways to pursue. I hope I can maintain my focus and stay on my “road map”  for the rest of the summer.   More about that road map very soon.

Posted in Uncategorized | Tagged , , , , , , , , , | Leave a comment

Statistics, Sports and School: Preliminary Research

Now that AP classes are done and the school year is starting to end,  I can now shift some hours in the day towards my “Statistics, Sports, and School”  course.

Here’s on my To Do List in the next two weeks: 

1. Play Strat O Matic!   It’s a game where you use individual player statistics to replicate a game play by play.  I got versions for MLB baseball, NBA Basketball, and NFL Football. It should be coming in the mail tomorrow!  I think the game will be a great way to help kids understand  the ideas of repeated sampling, probability, The great Statistics Teacher / Professor Jim Albert  has some great chapters on how to use Strat O Matic to understand the statistical process. More on this later.

2. Start Getting Through my reading list.   Here are my first two: 

Scorecasting, by Tobias Moskowits and l. Jon Werthiem   This is providing me with some ideas of great research questions to pursue at the High school level

Read our companion textbook:  Statistical Reasoning in Sports,   By Josh Tabor and Christine Franklin.  I have had the pleasure of learning from both of them as an AP Statistics grader over the past 7 years.

Stay Tuned:  I will  have a LOT to share  very soon.

Posted in Uncategorized | 1 Comment

Pedagogical Content Knowledge

Learn and Teach Mathematics and Statistics

Pedagogical content knowledge for Statistics

Pedagogical content knowledge means knowing how to teach a specific subject, discipline or context. There is a school of thought that the skill of teaching is transferable between subjects, so long as the teacher knows the content. However others argue that teaching strategies differ sufficiently across disciplines to create individual but overlapping bodies of knowledge, called pedagogical content knowledge. To me it is clear that different skills and approaches are needed in the teaching of different disciplines. The methods for teaching a foreign language differ largely from those for teaching history or science or cake decorating or jazz piano. There are also commonalities in all teaching, such as the need to build a relationship between the teacher and student, and building on students’ previous knowledge.

I first learned about the concept of “pedagogical content knowledge” in one of my favourite books – How People…

View original post 1,107 more words

Posted in Uncategorized | Leave a comment

Possible solutions, version 2: AP Statistics 2013 Free Response

Possible Solutions to the 2013 AP Statistics Free Response questions  have been updated.  This new version fixes a couple of wording/  typo issues, and provides a correct solution to #3 (Thanks to the AP Stats teachers at AP Central and Matt Carlton, among others) for their feedback and correction!


Posted in Uncategorized | 2 Comments

Possible Solutions 2013 AP Statistics Free Response questions. Try #1

Every year I like to take a stab at the publicly released FR questions for the AP Statistics exam.  I have attached by attempts at these questions.  Please read them,  critique them, provide more elegant answers, rip them apart.  As long as they create  helpful dialogue, I’m happy.

NOTE: You can access the questions at this link from AP Central.

Here is the first attempt!

Possible Solutions to the 2013 AP Statistics Free Response questions


Posted in Uncategorized | Tagged , , | 12 Comments

Prepping for the 2013 AP Stats test: common student errors, Part 3

Wrapping up:  Common errors by students for the last two FR questions for our end-of-year assignment.

Question 5: In this question,we wanted students to construct correct hypotheses for a test,  state/ compute the correct test statistic,  and make an appropriate decision about their hypotheses in context. In addition, students needed to use the results of a simulated sampling distribution to make a conclusion about a hypothesis test “outside the AP syllabus.”  The topic:  bottle filling machines.

  • Students need to define the population parameter of interest thoroughly.  They must refer to the correct symbol,  The population(s) (or treatment(s)) of interest, and the correct parameter name (the true mean amount,  the true proportion of people who agree).  Students often left out at least one of these.  
  • Students over-stated their conclusions when failing to reject a null hypothesis. A high p-value does not give you evidence that Ho is true.  They sometimes accidentally make  this conclusion when adding context.
  • Students give incomplete mechanics, especially omitting the degrees of freedom. If a ch-squared or t-procedure s called for, degrees of freedom  are needed in the mechanics.
  • Bottom Line:  get the details down. 

Students’ seem to have an incomplete understanding of simulated sampling distributions. After grading the “interpret a simulation” part of the  question, I wondered if students got full credit simply by “going through the motions” of getting an estimated p-value  via simulation without being able to answer a deeper question, or one that was phrased differently.  They got the “key points,”  but then made some conceptual errors about what the null hypothesis was, failing to distinguish sample SD from population SD, etc.

Question 6: In this question,  the goal was for students to read a scenario and a) cite specific evidence from equations or graphs to justify a statement about expected returns,  b) construct a confidence interval for a population proportion (and verify conditions),  c) apply an understanding of the interval to justify a real-world decision and d) synthesize all previous work to construct a statistically reasonable rationale for an alternate conclusion.  Topic: Deciding to use vans or coach buses for a business.

Common errors:

  • Students struggle to articulate specific evidence from a graph.  They usually said something equivalent to this: “by just looking at the graph, we can see vans are better.”  It was difficult for students to identify specific evidence from the graph that supported their claim.
  • Students did not give a correct “normality” check for a 1 proportion confidence interval. Many erroneously checked the “n>30” condition for means.  Others omitted the check altogether.
  • Students got sloppy interpreting the confidence interval in correct context.  They gave the wrong population, the wrong variable, or referred to the wrong parameter (the mean of the population  or “mean proportion of all samples”  instead of the proportion of all markets that will experience strong demand.

Advice for my students:  

  • Review technical details.  Do problems about probability, sampling distributions, binomial distributions, run the details of each of the major tests.  Learn the “large sample. normality” condition of each test.  Practice choosing the correct test at this site.  
Posted in Uncategorized | Leave a comment

Prepping for the 2013 AP Stats test: common student errors, Part 2

Ok:   two more questions to break down.

Question 3:The goal of this question was to identify the correct methods to compute different probabilities in a situation.  Students need to select the correct probability model for computing probabilities:  a normal distribution for an individual result, a smart application of the “at least one” rules of probability (or, perhaps apply a binomial model), and a normal model for the sampling distribution of a mean. Topic: depth measurements of the earth.

  • Not abiding by the mantra: Your picture is your path. Surprisingly, some students did not identify they were using a normal model (by drawing a picture or mentioning “normal.”  
  • Students struggled to use a binomial distribution to compute P(“at least one measurement is positive.”)  They were more successful if they used the complement rule (  P(at least one success) = 1-P(no successes).

Question 4:  The goal of this question was to  determine the appropriate inference procedure for a scenario (2-smaple or matched pairs t interval),  execute the appropriate mechanics for the interval, and interpret results in correct context.  Students also needed to show how to use the interval to make a decision about statistical significance.

Students did not distinguish between a completely randomized design and a matched pairs design.  As a result, they picked the wrong test.

Students could not construct the correct formula for the confidence interval of interest.  I was surprised how often this happened. This disappointed me, because I provided many tools to help them practice this throughout the year.  They have a formula packet, an extra credit review task on this topic, and other tools. At the very least, they could identify the name of the test, and write out the correct inputs. You can omit the formula and get full credit for stating the correct test name (“paired 1 sample t interval, mean difference”) if you write out the inputs to the interval with correct notation/ names.  But if you write out the wrong formula, you may get no credit (wrong test,  wrong calculations to answer)

Students confuse “interpreting the meaning of the interval in context”  with “interpreting the confidence level of the interval.” …And then they get that wrong.  Firstly, interpreting the interval simply means you’re trying to get a range of plausible values for the true mean difference – just put context to that idea. A common “Failed attempt:”  In all possible samples, the true difference in growth rates will fall between  0.97 cm and 3.01 cm 95% of the time.  This is NOT true: We assume, with this procedure, that the true mean difference is fixed. Repeated intervals constructed from new samples of the same size have a 95% success rate at capturing the true mean difference in growth rates.

Posted in Uncategorized | Tagged , , , , | Leave a comment

Prepping for the 2013 AP Stats test: common student errors Part 1

At my school, we gave our AP Statistics students a final assignment (notice I don’t quite say assessment) to help them prepare for the 2013 AP Statistics exam on May 10.  This was not an attempt to replicate an actual AP exam in the traditional sense. We didn’t want to.  We really wanted to incentivize students to sit down, quietly prepare at an individual level, and synthesize what they learned this year in a quiet, focused environment.

What we did:

  • We used old  AP questions, but concealed how/where I got the questions. I retyped, changed numbers / context when possible.  I strongly advise against teachers using a single AP exam as a tool for summative assessment.  The answers are out there and easily found with minimal effort.  At our school we are very transparent about how to go to AP central and find practice questions and rubrics.  So if we use real AP questions as a source, we mix questions up, conceal how / where  we got them, change  real AP questions into questions “inspired by AP.”
  • Students were given 5 class periods to complete the 40 MC questions, 5 FR questions, and one investigative task. This is 225 minutes: 45 minutes more than a typical exam.
  • Students were able to bring in one 8.5 x 11 inch paper with any HAND-WRITTEN notes. This had to be brought in on the first day of the assignment, and could not leave the classroom for the rest of the week.
  • Students also could not bring the assignment home:  All work was done individually in the classroom.  Students were allowed to discuss with others, but not “get answers.”  They could also “look up”  topics /. concepts/ other problems that might lead to insight. But nothing could be brought into the classroom after the fist day.
  • This was worth 10% of their course grade.  We will give formative feedback using rubrics from the AP. Grades will be assigned to their work. AP score equivalents will inform but not dictate, how we assign grades to students’ work.

Below is a log of “common errors” from the first two  FR questions I gave them.

Question 1:  Students had to explain how to estimate a median value from a histogram,  compare two groups by a analyzing a quantitative variable in context,  and explain the relationship between a mean and a median in skewed and symmetric distributions. The topic : Teacher/ Pupil ratios in each state.  States were grouped by Western and Eastern.

  • Students read histograms like dot plots.  They use the endpoints of each interval as substitutes for individual data values.  Some didn’t communicate or recognize that non-integer values are possible. As a result they erroneously reported the median value in a group as “15” instead of “some number between 15 and 16.”
  • Students need to make explicit comparisons.  When comparing two groups students need to answer the question, “Who wins? Is it a tie?”  When asked to compare distributions, students need to make more explicit comparative statements “____’s average is larger than  _____’s average,”  “the same as,”  “more skewed.”
  • My students could improve their language for describing shape of a distribution.  Evenly distributed is vague. I think it means uniformly distributed. “Unimodal”  means “one clump of data.”  Many symmetric distributions are not “even.” Many symmetirc distributions are not unimodal.
  • Students mix up which features of a distribution are  “shape” and which are “spread.”  Example:  “The western states were skewed right and had a wider range than the Eastern states.”  They never mention anything about the Eastern states’ shape (symmetric?,  roughly normal?  skewed left?).    Another example:  “The wide range causes the mean to be pulled up.”  It’s the skewness, not the high range, that causes this.
  • Students do not give a correct definition of “range.”  The P-T ratios in the east produce a range  from 12-22″ is NOT correct.    The range for this group is 22-12 = 10.   This didn’t necessary result in a point deduction on this problem, but it could in a problem where it matters.

Question 2:  In this question, students had to describe how to execute a simple random sample,  identify/justify an effective way to stratify a random sample, and explain a statistical advantage of a stratified sample over a simple random sample.  (Topic:  a survey about a new lunch program in a school district)

Common errors 

  • Students must describe more specific plans that another person can execute without having to ask questions.  “I will have a random number generator select numbers from  1  to 2500, with no repeats.   
  • Students mistakenly say that SRS’s are biased, and stratification removes bias .   If this were true, then that would mean that simple random samples systematically over-estimate (or under-estimate) population parameters.  This is a very common error.  Stratification does two things:  1. Stratification ensures sufficient representation of each group. Note: the benefit is not in EQUAL representation, but in sufficient representation. Suppose High-schoolers make up only 10% of the population.  An “unlucky” SRS of 200 students may result  in a disproportionate number of high schoolers (maybe only 7 or 8 out of 200, maybe 40 out of 200) This causes values of our sample estimates to  “swing,’ or vary more than if we had 40 seniors in our sample. We could “set” this value with a stratified sample. We could then use proper scaling to get a good estimate for satisfaction level in the population.   As a result… 2. Estimates from stratified samples typically show less variability (more prescision)  than simple random samples.  But both sample random samples and stratified random samples are unbiased methods of sampling.  
Posted in Uncategorized | Leave a comment

Afterthoughts: MIT’s Sloan Sports Analytics Conference

Well, that was an eventful two days at the 2013 MIT SSAC.  I blogged about this repeatedly in previous posts.  As a teacher of statistics, what lessons will I take home from this event? Where do I go from here? 

  • Take risks to connect with people. I talked up two presenters. First, Tim Chou He works in Los Angeles as a project manager for an engineering firm. He’s also a high-school football coach. I asked him if he’d be interested in being a resource for my students in “Statistics, Sports, and School.”  Before I could get out the first sentence, he said, “I’d love to be part of this.”  We then talked for about 90 minutes about his work and the new course. We made plans to work together and find ways for him to help our students. The second one was Nate Silver, who was getting assaulted by fanboys and gushers at every turn. I kept it class, shook his hand, and handed him my card. It helped that someone noticed where I was from and said “GREAT school.” I asked him if he’d consider spending the day with our students, and he was very receptive. So two GREAT contacts to follow through on.
  • You don’t need to be a genius from MIT to ask and answer meaningful questions  in sports analytics. Tim Chou’s experience coaching football was probably the most important in his efforts to find some metrics in football that caught the eyes of the professionals in the field.    The researchers and statisticians repeatedly discussed that GM’s, Coaches, and owners catalyzed research questions.
  • My students can do this, and I can help them.  I was initially worried that I would need to become an expert in sports analytics in order to be helpful to my students. But I am better understanding how I can be helpful in moving them forward through the process. Here’s what I can prepare for:
  1. Collect and organize as many resources students could use to “play in the garden” of sports and data. Good people, Good databases, good papers, good books, good use of our school LMS (learning management system) to have them collect their  own resources /thoughts,
  2. Prepare activities around common issues working with data: Here’s what’s bubbling up: Misconceptions about randomness, how the short term “feels” in the midst of long-term predictions, displaying data so they tell a correct, important story,  Differences between two players / teams could easily be due to chance. Definitely this one: Inputs and outputs of mathematical models need to be clearly defined. Use units that make sense to the math-averse. In nearly every good talk, the presenters made sure that variables were expressed as “Points per game,”  “additional yards per quarter,” “Points above what a replacement player would contribute,” etc.  The best presenters took the time to walk through a simple example so folks could “click in” to what they were talking about.
  3. I need to put my “student cap” on, and ask my own questions this spring and summer. I want to know what’s possible for students to do next year.  Can I do my own sports analytics project?  I need to brainstorm a bunch of questions, and zero in on ones that get me jazzed. I need to give myself a deadline, answer them to the best of my ability, and share my results (probably on this blog).

This was a blast, and I highly recommend it. Soon, the real tough work will begin….

Posted in Uncategorized | Tagged , , , , , , , , | Leave a comment

This was one of my favorite panels of the conference.  If my rambling pseudo transcripts are too much, click some of the cool links. We listened to the leaders in data visualization talking about the craft.  They all start by first referencing a true pioneer and guru in this field, Edward Tufte, who said “Minimize interface design to get to the content.”     

Martin Wattenberg,  Head of “big picture” Data, visualization group, Google.  Blog
Joe Ward, Sports Graphics Editor, NYTimes. He’s responsible for some gems like this one
Ben Fry,  Principal, fathom.info. If there’s a top ten for “coolest visualizations ever,”  I bet this ste gets a few spots.  This one is awesome. 

Moderated by Sam Hinkie, Executive VP of Basketball operations, Houston Rockets.

 Q: OK, visualizations are cute, even beautiful. But  where’s the usability to make decisions?
Martin:   One great example is at   babynamewizard.com .   People will spend time on this site  for hours, deciding on the right name.  But there are thousands of time series embedded in this.

Q:  What are some of the most common mistakes you see with visualizations?
Joe:   Overuse of color:  As little as possible is better.  Typography: less is more.
Martin:  We discovered a good rule at Google:  when you find a horrible error you didn’t know existed in your data, then your visualization is valuable.  You discover things that you never anticipated.  Ben Fry’s Windmap shows many unanticipated patterns we never expected. Also high-end dashboards have a sense of uncertainty about our data. Very seldom do we see beautiful demonstrations of uncertainty. I think great visuals show the uncertainty.
Martin:   Some are happy with pure numbers.  Very rarely does visualization lead to a very different decision, but reaching those decisions often happens much much faster. The speed of its effectiveness is its value.   As long as they can get back to the data, they trust it.

Q: We’ve pulled the vizualizations from a few of the research papers being presented at the Sloan Conference. What do the experts think?

Tennis Research Project:
Joe:  Lots of noise introduced beyond your signal.   I would delete the surrounding courts, people, any distraction.
Martin:  This is an excellent first step…. Now let’s ask: what outcomes do I care about?  What shots are most important?   Can I start making comparisons directly.
Joe:   More of the court to show you’re using the service boxes.  Get rid of grass stripes.  Edit. Take out as much as possible. The data are your story.
Martin:  A sense of importance is clear.   There’s no sense of uncertainty. ..I’d like to see that. I’d love to see many versions of these to compare.

They show a visual of data Larry Sanders near the basket:
Joe: This is really good.   Clean, gets to the point.  Clear comparison of Sanders/ Lee.  We did this with teams, and added Performance relative to NBA averages.

In comparing Steve Nash / Dwight Howard:
Joe:  drop shadows on dots changing the color of the dots, and changing the color, which has meaning.  I’d get rid of that.

Q:  How does a team think about augmenting their staff with resources with data visualization?
Martin:  
if you get number guys, they will organically go there.   When you show things to fans, then graphic designers needed.  First find people who love numbers, and that’s 75% of the way there.
Joe:  If you have a design problem to solve, somebody has probably solved it.Example:  Cholera Map.   They did this 1850.   Last Year, Washington Post created a similar map  gun store and homicides.
Ben: Anybody can pick up a road atlas and find their way.  And online is not quite there yet.  The cartographers are ahead of us still.
Martin:  You should make sure your information tech folks are happy to work with out a final goal; it’s an iterative process on constant tweaking.

Posted on by roughlynormal | 2 Comments

MIT SSAC 2013: True Performance and the Science of Randomness

Time for another all-star panel.   Plus, hopefully, some real mathematics/statistics.   Our Moderator is Daryl Morey, GM of the Houston Rockets. He reminds me of Chris Farley on SNL.  Except he’s a GM of a major sports team.   Stars are:

Alec Scheiner, Cleveland Browns 

Phil Birnbaum, By the numbers  author, and sabermetrician

Benjamin Alamar, Menlo College 

Jeff Ma, tenXer,  one of the MIT Blackjack Team. 

and our returning Champion, Nate Silver.

p.s. .. LOVE that the students at the MIT Sloan School are introducing the speakers, and running the conference.

Q:  Speaking of serendipity and randomness, what got you to this spot?

Alec:  I worked at a big law firm at DC, doing private equity work.  Jerry Jones serendipitously called a colleague of his at work.

Nate:  My route is also serendipitous.  We courted controversy when I bet Joe Scarborough $1000 on the outcome.  As much as one can say I used good methods in election prediction, a bit of luck along the way helped.

Jeff:  I was part of the MIT BlackJack team.  We wrote the book, it blew up, “21” blew up,  and then Moneyball  blew up – my chance to look into sports.  We sold a sports business to Yahoo.

Ben:  Jeff hired me as a consultant.  They needed an economist to build a stock market for sports. at ProTrade we developed a model.  With that article,

Phil:  I just blog about sabermetrics form home.  I am just as lucky to be here as the rest:  Every little step you take in life is random.

Question: To find the signal in the noise, you need data. Circumstances change in each sport. One main issue by the time you have the signal, the environment changes.  What’s the best way to attack this?

NS:  On the baseball panel,  getting to the root causes is important.  Probably same in all sports.

JM:  Being right is sometimes bad. It’s important to separate the process from the outcome. When something doesn’t make sense in the data, find the root cause. 2012 NBA:  scoring down.  Why?  What was the root cause?  Focusing on process helps.

Alec:  Agreed. We’re trying to rule out predictors, things rather than find predictors in haystacks.  There are only 16 games per season, so a  lot of noise. I think we have a good group.  Others think we have a lot of losers.  Are the teams winning Super Bowls doing everything right?  I don’t think so.

Darryl:  Misattributing signal for noise.  What are some great examples of this?

JM:   Odom/Durant Decision.  The numbers said pick Durant over Odom,  but the reality was that Odom was injured when data was compared.

Alec: We have a bias for 7 foot, athletic players. We err around those mistakes. Understanding the variance in those players as part of the process helps you be more realistic / objective.

Phil:  You are evaluating a player on many different dimensions, each of which has randomness. 250 w/o power  vs .250 with power:  a .290 hitter can hit .325 reasonably often.

Nate Silver:  We think of “luck”  and skill as polar opposites. In the short run, luck dominates. In the long run, skill does. How much short term interference do you have?

Alec:  in NFL,  we have very little time to prove oneself.  16 games.

Darryl:  The Odom /Durant decision reassures me. Nearly every team would have preferred Durant.   We have our own judgment, and computers:  which can’t actually produce random numbers.  What are humans good at? Computers? Balance?

NS:  Humans find patterns well. We sometimes have overactive imaginations.   We see false patterns in noise all the time. Humans, however need to make hypotheses. Computers need to be used carefully/ thoughtfully/purposefully.

JM:  Humask ask, computers answer.  Start partnering with those in industries –  to understand what are the questions that need to be answered. The “non-math”  folks know the questions to ask.  But the mathy folks need to be approachable, willing to listen.

Ben:  Computers help up narrow the range of what is plausible with randomness. If we let data reduce the risk around the risky decisions we make, that’s helpful. Data / computers identify the degree of risk in our moves/ decisions.

Darryl:  When do you overrule what the data suggest?

Alec:  I thought last year was interesting with RJ III..  Was it the right move? Most people say no.  We worked hard to see beyond the surface to see if its a good/ bad move.  We son’t know for 5 more years.

NS:  Depends how successful your algorithm is.  Yes, Use your horse sense. Soem things are really hard to solve no matter We forecast Senate ones. There are special cases, but we have to separate those from the one you’re personally invested in calling some cases.  I think if your formula is good, then the model should usually be trusted.

JM:  Models stabilize over time, given oversight.  Models help you check your emotional decisions.

Darryl:  Jeremy Lin. There’s no data for players like Jeremy Lin,  but little confidence in his outcome.

Darryl:  Jeff’s Book and Nate’s Book are very transparent in shifting the odds, not being sure about their answers. How do you sell yourself?  It’s not always popular.

Alec:  It’s hard. We find the things we’re sure about first, to gain their confidence. It’s a constant sales process. They’ve had tons of success in the past. So to convince them,  it’s a challenge.

JM: Let’s look at Paraag: He has been deferential and advanced. What if he were more aggressive? Would they have been stronger?

Alec:  You pick your battles.  You need to influence people.  It’s very delicate.

NS:  You still need a good business, good management, good culture.  Analytics can’t help with that.

Ben: One of the dangers analysts face:  your sureness, in the face of others who are certain you are wrong. “Why is Burt Lopez kicking our ass right now?”

JM:  In you create this culture around being data driven,  that probably relps, right? It’s just a way of making better decisions.

Phil:  Do you ever talk about that uncertainty?  Does it actually happen?

Ben:  We try to.  If it’s about a single argument, you miss the boat. The process involves risk.  It’s a tough sell.

JM:  Back to the idea: process over outcome.  Think about hitting on 15, dealer has 9.  THe process is clear, but you win 60% of the time (you’re a genius)  lose 40% of the time, (and you’re an ahole).

Darryl:  Let’s talk about weather forecasters…

NS:  Forecasters cheat, because their incentives are asymmetric.  They did figure out forecasting because of chaos theory. There’s a limited degree of possible precision. How do you convey uncertainty?  Hurricane predictions is a success.

Darryl:  Q:  OK smart guys.  How do you measure good process?

Phil: You identify a specfic question you have to answer. Measure talent. That’s unmeasurable. What correlates? the broad outcome?  You can try to measure something that correlates better with talent.  In baseball, pitching statistics, WL record has lots of noise. ERA is better.  From there, Expected ERA even better.  The process is trying to figure out relationships between performance and talent that is less variable.

Alec: If you ignore the process often, the process is bad.

JM:  Outcome is important, but this will emerge in the long term.  Hard to use outcome in the short term.

NS: ID those who use it well:  what are their characteristics?  Learn about this indirectly.  Over the long run,  what metrics correlate with good business decisions?

Darryl:  How can you get good training for this…. is gambling?

JM:  Yes, gambling (poker, blackjack) when you can get an edge. Losing $100K

NS: Poker players are best at estimating on the fly. Also Backgammon.  Interesting: Your mistakes cost you a lot.  But analytics help you filter out  the really stupid decisions.

Phil:  Play a baseball simulation game:  Strato-Matic.  It’s great to use dice rolls/ spinners to observe the randomness. You get a feel for what happens during he game:  It’s very hard to predict.

Ben:  Always estimate the likelihood you’re right.  And then keep track.  Anything.  We should be good about getting a sense of this

Darryl:  Gambling is a good way to assess your level of sureness.

Darryl:  I wonder if you can “smooth your heart away”  until you lose the “heart” of the data… comments?

Alec – What a terrible question. Pass.

Q:  Can we change the results-oriented culture?  Is this changeable?

Alec:  almost impossible in sports.  Imagine explaining that to your fans.  Little things: at the Cowboys:  look at how the Rockets are.  Look how good they are. That was a good framing.

JM: Education. Explain why you do what you do.

Darryl:  Hire people you respect.  Some teams measure scouting staff,  which makes sense, until you hammer them over their decisions. (SOUNDS FAMILIAR, TEACHERS?)  In sports, informaiton is important. Lots of teams don’t have a collaborative process because info gets out.

JM:  Kevin Compton 1st rule:  Cancel your local newspapers.

Darryl: That won’t work.

Q:  There’s only one winner usually.  Does that incentivize riskier decisions?

JM:  Darryl, you replied, when I asked you Does it scare you that BB is so hard/ random?  You said no, because the noisiness can help me leverage that. #2, you said, yes I am riskier.

Ben: It’s not 1 of 32.  What does that risk add to your situation? What’s the added value?  …

Alec:  But is risky going “against the data,”  or “against the grain?”

Darryl:   “Variance?”

NS:   In Baseball, we (in certain cases)  like a high variance strategy, hope for a hit.

Q:  dichotomy between  process and outcome.  Don’t outcomes influence process?

Darryl:  I don’t get it.  Sorry.  PASS.

Q:  As players play to adapt to a measurement, at the expense of innovations  how do you fight the observer effect?  (SOUNDS FAMILIAR, TEACHERs?  )  

JM:  That’s Bad metrics. then you fix your metics.  If it’s not right, then it’s not right. If it is, then it is.

Ben:  In the draft situation, we don’t have NBA data.  we have to use proxies.  We do protect it.  People respond to incentives to have good numbers.

Darryl:  Black box metrics are a BAD idea.   As a manager I have to understand everything.
Posted in Uncategorized | Tagged , , , , | Leave a comment

Football Sports Analytics reminds me of using analytics for teaching.

Questions Posed by Andrea Kremer of  HBO’s Real Sports with Bryant Gumbel.   For this conference,  some big brass in the NFL came to play.GMS, COO’s, GM’s. Also, Aaron Schatz,  Founder of Football Outsiders. 

Kevin Demoff, COO, St. Louis Rams.

Scott Pioli former NFL GM, KC Chiefs.

Paraag Marathe, COO, SF 49ers

Aaron Schatz, Founder, Football Outsiders.

Q:  Do analytics play a role in player evaluation?  

PM:  It’s one tool, and it’s a delicate balance between scouting and data. WRT analytics, there are reams of data about all sorts of things.  Lots of opportunity to augment the scouting reports. The best teams marry both in a good relationships.

AS:   Statistics see every play, including the unmemorable ones. They also allow you to compare an individual to the group.

SP:  “gut”  is based on previous information and experience. That’s analytics to a degree.

Q:  what NFL Combine tests are most “telling?”  

KD:  We graded our players ahead of time  before they did the combine. No single test.  OL coaches look at first 10 yards of the 40.  Ultimately, you are trying to show something different. Most perform as we predict pretty closely.

SP:  I’m not a big fan of the combine.  There’s physical speed, and playing speed. Manti T’eo , in playing speed, is remarkable, even though his pure speed is not so good. we had a 4.3 guy who was not fast on the field. Measurement do have value:  QB hand size . Tom Brady has huge hands.  Others are misleading to me.

PM:  40 yard dash and WRs. THere are a few predictors.  The flying 20:  the 20-40 speed separation speed seems to be a good correlate.  Correlates to separation speed for a receiver.

AS:  We’ve seen the opposite:  only the first 10 seconds seem to correlate. … weird. Also the Vertical jump correlates.  You have to look at it all in the big picture. Speed Score: based on 40 time with to weight. (F = ma, kids!) .  Mark Ingraham is not fast enough for his size.

SP: So much of this game is reaction and them moving the speed.

Q: Do you do other drills/ measurements not in the NFL combine?  

KD:  We

….  lots of individual observations, very little about process, using data wisely. Everybody sounds like they are looking for needles in haystacks.

Q:  Are there key measurable predictors for certain positions?   

PM:  No big theory that I’ve seen  There’ so much covariance between predictors.  There’s no hard/fast linear model.  So many unique systems that become clear.

SP:  Football is  based on so many interdependent relationships, it makes it extremely difficult to value analytics.

PM: That’s why trading players is frought with risk.

SP:  On the other hand,  Wes Welker – a success story after

AS: I don’t know what analytics can do to fit your system, but you can compare him to a “peer group,”  I suppose.

SP:  Not all players are the same in different systems

AS:   Jason David.   on the

KD:  You’re looking what 3-4 OL’s can also be 4-3 OLs? It would be great to know who

SP: You must learn your players very much – that’s essential for a successful free agency system.  The only people who know the players that well are the coaches.

Wow… this is starting to sound like the challenge of applying data to a classroom, no? 

Q    What’s the value of draft picks?

SP:  HUGE.  Having picks are currency.  Many are going to blow up.  Also trades super helpful.

AS:  It’s like the Patriots have mind control over other teams giving up their pick.  We’ve looked at the Jimmy Johnson draft chart.  If you go back in time.  THe best GMs amass picks and trade up the quality and quantity of their picks.

KD:   Great in theory, but often not in practice.  Everybody has a different vantage point.  If the time frame for decision making keeps shrinking,  it’s harder for them to make decisions in the abstract. We’ve all made bad decisions, but depends on the situation.

Q:   Your philosophy between economics and what you’re trying to do.  

NOTE:  It appears clear from this session that data analytics to measure good predictors for success in football is very very HARD.  So many decisions change once a circumstance changes.  Also, decisions create circumstances.  

The same questions keeps coming up:  “How do you quantify that?”   The panelists are left dumfounded.  Every time.

Even the football sabermetrician  can’t do this.  The answers are coming from the experience of the GMs.  THey are using their experience and instinct.

Q:  The Wonderlich Test.  Other psychological Tests. A new test:  Player Assessment Tool. What do we want to try to quantify in terms of evaluating players’ non-athletic (mental, psychological) abilities?  

SP:   Lots of biases in the Wonderlich test.  ( blah blah GET TO THE POINT).  I want to find out more about the “makeup” of the individual.  You can teach someone work habits.You can’t teach work ethic.  Selflessness:  are  they more team / self oriented?

KD :  Coaching matters…. “who do you remind me of?”  What can be done to give your coaches the most information?  The personal aspect is an untapped area.

SP:  With so much change/ turnover in organizations,  having a standardized idea of what you’re looking for.  As you age, you’re referencing people others don’t know: especially with a lot of turnover.  I think it’s a huge advantage in SF – longevity and continuity.

PM:  Consistency and longevity matter greatly.  changing systems (especially with the presence of a salary cap) is not good. Consistency breeds success.

Q: How can you convince a coach to listen to analytics?  

SP:  Mutual respect.  We have lots of competing egos and nonsense.  You need an open minded head coach, and the presentation matters. I encourage you to work on your delivery, your ability to communicate.  It impact how your information is received. Don’t be smug, smarmy, etc.  For football people, understand the role that analysts can have on your success.

PM:  Negotiations and Organizational Behavior.  Solve something first, but a 5/10 with good communication is better than a 10/10.

AS  Watch film with your football folks. See how the coaches  / scouts see things. 

Q how do you use analytics for coaching?   

PM:  Aggressiveness on 4th down,s time management tendencies on 4th downs. Presence of esoteric

Q: Most overrated / underrated in NFL?  

SP  Not answering.

KD  Every potential FA from the Rams.

AS:  I’m the outsider: I’ll say it.  In general the most overrated – those whose athletic abiity does not translate.   Boom/bust rushers,  D’Angelo Hall is an example.  10th and 20th is no a difference.  89th is a problem.  Underrated:  rookies who play well in smaller markets, and those who fail on TV.  LeVanTe David and Tony Romo.  He’s one of the best 6 or 7 QB’s in the league.  Bad Luck with national TV.

Posted in Uncategorized | Tagged , | Leave a comment

MIT Sports Analytics Conference: Random Ramblings on “Revenge of the Nerds.”

I took notes on the “Revenge of the Nerds”  session at the MIT Sloan Sports analytics Conference. .    Here are my random ramblings.   It’s incomplete, possibly wrong, and certainly has typos.   Deal with it.

Panel Leader:  Michael Lewis, Author of Moneyball.

Mark Cuban, Owner, Dallas Mavericks.
Paraag Marathe, COO, 49ers.
Daryl Morey, GM, Houston Rockets.
and returning champion,
Nate Silver:  Statistician, Psephologist, and Author, fiverthirtyeight.com.

Paraag:   Each pick has a currency value:  what’s the right value for each pick?   Started 2001 to negotiate contracts, personnel decisions. Were in Salary Cap Hell for a while.  12 years later, almost Super Bowl

ML:  Were you shock there was a career in this?

PM:  Yeah:  To get in, it’s about who you know.   Insular.  Cracking the world is hard.  Opportunity is not always fair in sports.

ML:  Is the work meaningful enough that you’re satisfied? Or will something new come along ?

PM:  Seeing how people reconnected at the SuperBowl was very uniting, brought team families together. That may keep me here.

ML:  Darryl, You?

Darryl:  2nd grade:  Bill James’ Abstracts.   Get a Commodore 64 when you’re young.  Playing Fantasy BB, got depressed at Northwestern.  StatsInc:   applied there, made myself nuisance,  until they hired me.   (Don’t do that, It worked once).

ML:   Is this a career endpoint?

Darryl:  Yes.  I think it’s a miracle I got this job pre FB era.  I have lots to thank.

Nate:   MY athletics career ended in grade 6.   Studied Econ a U Chicago.  Stat nerd as a kid. Consultant in 2000.  Bored as shit.  PECOTA sold to Baseball Prospectus.  played poker.  It bubbled.

ML:   There’s so much young intellectual energy crashing this party. Exportable? Sports is a great lab.  The kind of thinking here applies outside of sports.   Nate: you’re a good example.   You left sports, and had this huge effect in our political life.  Are you special?

NS:  Playing Fantasy, etc. is a good way to learn applied statistics.  Sports has great data sets.   Good criteria for success.  Very testable.   In politics, you can be wrong for four years at a time.  In spots, there’s “justice,”  I guess.  Great way to get your training wheels.

ML –  but your path is ODD.  Are there others?

NS:   Sabermetrics is light years ahead of anything I did.  Amazing what’s being done in sports.

ML:   Mark Cuban:  What’s your sports resume?

MC:   I was an all star player in HS.   In Basketball,  a JCC AllStar (LOL).   I was a fan, always an entrepreneur.

In 90s being a Mavs Fan was hard.  Sitting in the empty stadium when the Mavs undefeated, I got … “As a businessman, I can do a better job.”  Always from a business perspective. Paraag said, “12 years to get within 5 yards of a title.” That’s how I feel.  But when a sports team wins, the whole city changes.  The entire city .  I have a losing team right now. It’s really painful.

ML  were you aware of the data revolution?

MC      Yes:   I took grad Stats at Univ Indiana:  Wayne Winston used Sports as a foundation for problem solving.  I buy the team,  and then I turn on Jeopardy…  My professor Wayne is there, kicking ass!  I contact him: let’s start evaluating teams.  We started digging heavily into analytics.  Most teams didn’t know what it was.

ML:  Once you went down this path,  did you see  clear misevaluations of talent?

MC:  Yes! …and owners were pissed. They told me,  keep your mouth shut.  Other owners going Mr T on me.

ML:   When Moneyball came out,  I was shocked how controversial/angry people got… but I was costing people jobs, so I get it.   Status is big in sports. Your pecking order matters and you’re dealing with high testosterone males.  The Moneyball argument disrupted his structure.  It revelas that the GM is more important than the coach, perhaps.  That was troublin I’m wondering:  when you first hit the sports world:  what kind of friction did you encounter?  Now, what’s it like?

Mark:   Now,  no friction, I own it.  Now, I have years of data. Then, I didn’t know how well it would work.  Don Nelson, our old Manager, was still there. Trying to strike a balance.  #1 job is to keep your job.  They will take huge risks.  Incentives are screwed up.  As a decision maker:  talent evaluation vs analytics.  BB doesn’t have great analytics yet.

ML:  Even as the owner, is it more/less easy to impose new ideas?

Mark:  Easier.  Now,  you need to look how they reverse engineer their thinking.

Parag:   It’s amazing:  same work.  If they win you’re brilliant.  If not, you’re an idiot. It’s about outcome, not process.  I was a youngster telling the brass stuff with analysis / stats, and they felt threatened, especially if they aren’t stats folks.  It’s not about the analytics:  The majority is communication and representing your work that gets buy in from the scouts, the GM, the owner.  .  When I figured that out, things changed for me.  Heling shape ideas so it was the collective group’s idea.

ML  did you hide the fact you were the smart guy?

Paraag:  It’s an organization’s decision.  It’s got to be communicated well.  … Today, things are much better even 3-5 years ago, b/c the market is embracing outsiders coming into the industry.  The sports marketplace is more open to people coming to new people. Football is last,

Darryl:   In Basketball, analysis matches what coaches suspected.

ML: Are the incentives of coaches different than those from general managers?

Darryl:  Coaches are treated poorly,  and rationally look at the short term. As GM’s we look longer term.

Mark:   Coaches and GM’s don’t evaluate talent in the same was. Coaches think they can fix everybody.

Darryl:  Coaches have a plan –  some players don’t execute that but produce collateral benefits.  GM’s see that, and coaches look too micro about “his plan.”

And you have to balance all these issues.

Nate:  In Baseball,  2003, There was certainly a Sharks vs. Jets kind of vibe.  But return on investment comes from young players who nurture potential talent.  The Best scouts use data analytics as a baseline upon which you improve.   Knowing your place in the constellation is helpful.   Less  moves of the “two back. one forward” kind.  In sports, eventually harmony emerges. In politics, a lot is total bullshit that has no value to society. 

For example.  At TED conference.  Some  of it is great, and all of it sounds great, until you ask an expert. the look deeper and realize that  some is total bullshit.  Once you get below the surface, you can get discouraged.

ML:  What will you pay $$ for in analytics?   Where are the important fields of ignorance? Are there diminishing returns on going further? 

Nate:  Diminishing returns, but not there yet in baseball. Not exhausted .  New data with codified scouting info. If I did PECOTA today with new data:  movement of players/ object on field.  New info, little low hanging fruit though, but plenty for new creativity.  Can we quantify a good curveball?  That would be cool.

Paraag:   In Football, a lot of unchartered territory:  Especially  #1:  Mental Aptitude. In FB, this has  a lot of impact  on competitiveness.  Physical differences are small.   Mental differences are vast.  #2: injury prevention – one player destroys a season in FB.  Soft tissue injury prevention, endurance.  Projecting their susceptibility to injury.  #3:  In-game management in its nascent stages .   In game strategy what formations are succesfful? Starting.

ML:   50 years from now,   will people think in-game  FB strategy was barbaric?

Paraag:  Currently, we’re not  using what we know.  If you have a good outcome, the process doesn’t matter. A few (Belichick, Payton)  are applying it during the game.

Darryl:   Potential is huge: We’re not getting “XYZ data:”  realtime data  of all players and the ball  captured at 30FPS.  That’s where the action is.  Multiple killer apps there.  We’re nowhere on the court in basketball.  I think offenses/ defenses will be completely different  in 10 years.  This data should allow us to exploit inefficiencies,  create synergies within skill sets.  Lot’s of innovation.

Mark Cuban:  XYZ data capture is the tip of a big iceberg.  Also in practice/ training.  We have a hard time developing talent:  what can we learn there.  Medical is incredibly important:  We’re doing genetic testing to pick the best anti-inflammatory. We’re locking in our medical staff longer contracts than our players.  Team psychology. Why?  In BB, we can project who the best will be. WE knew LeBron would be great.  He top 10 were known.  Is there a way to develop / nurture folks into the top 10,  like Baseball often does?

ML:   What’s hard to measure? 

  • Team psychology
  • Nate:  coaching.   Are there coaches that can bring out talent? 
  • Parag:  coaching. Making sure O and D have complementary skill sets.  The sum create a good team.   The styles often don’t  match. 
  • Darryl:  Medical staff: finding/ getting the best.  Do clinical trials on Yao Ming’s foot?  It can’t happen. 
  • Mark:  Organizational Dynamics.  The decision must be in the mix so a decision can be made. It’s hard to be a decision maker and be removed.  I do what I do because there are organizational dynamics to observe.  If there’s conflicts, we’ve got issues to address. 


Posted in Uncategorized | Leave a comment

“Statistics, Sports and School,” Part 3: beginning research

I’ve started my research for my “Statistics, Sports, and School”  course.  I’ve talked about it here  and here in the past.   Here’s a synopsis of my research so far:   

  • I have too many books/resources  to read about  on mathematics/sports,  statistics/sports designing studies,  etc…
  • I’m  “lunching”  and “networking” with as many people as possible who could be potential resources, advisors, “special guests,”  etc . I want to get  Nate Silver and Michael Lewis on my “potential speakers / mentors”  list.  … I wonder if this is possible!
  • Learning how to use R via Coursera courses and other resources.

I’d love to get involved with some other math/ statistics teachers who currently run / do Fantasy Baseball.    I want to see how feasible it would be to design/  run a “mini session”  of this in the course.  Any takers?  Let me know! 

Posted in Uncategorized | Tagged , , , , , , , | 2 Comments

Are there any math teachers out there that would be interested in something like this?

Posted in Uncategorized | Leave a comment

“Statistics, Sports, and School,” Part 2: It’s a Go!…Now what ?

Earlier this year I posted about a new course proposal entitled “Stats, Sports, and School.”   My proposal was accepted!   This means that I will be preparing for this course until it launches August 2013.  

Now the Hard Work begins.

I want kids to be able to pursue their interests in constructing a statistical research project.  On the surface, their research topic should be tied (in some way)  to sports or sports medicine.

So I have some questions for you.  I’d love your comments: 

1.   Imagine you’re a student who’s just been dropped into this course.  What would you be interested in learning more about / researching in the sports/sports medicine field?

2.   Imagine you’re a student who’s just been dropped into this course.  What would you be interested in learning more about / researching in the area of statistics/data? 

3.  After you leave this course, what would you hope you have experienced. learned. or achieved?

Answer any of these or all of them.

Thanks.

Posted in Uncategorized | Tagged , , , , , , | 4 Comments

November 12: A day in the Life of a math/stats teacher

The following  stream-of-consciousness account is part of the “A Day on the Life of a Math Educator”  blogging initiative. Names have been changed to protect the innocent.

5:47 am:   I’m up!
I have a lot to do today. I’ve been working on organizing a presentation about a nutrition study being done on our campus. Today is the day that we decided to have the event. I took on the task of organizing who would present, what would be presented, who would film it, publicity, thank you gifts, and finding a venue for the presentation. Most of it’s done, but a few loose ends need to be tied up.   I have to get gift bags for “Thank you” gifts for  presenters. I need to compile four PowerPoints into one file to save time during the presentation.   Ugh.  I should have done this Sunday, but I was helping my hubby recover from his puking and 24 hour flu. So it’s an early trek to the grocery store to pick up gift bags.  Remember the receipt.

7:00 am:  At school!
OK…. I got the gift bags, found the receipt. I hope I get reimbursed.  Now time to think about the day… What did I not get done this weekend that must get done ASAP? I rattle off the list:

  • Again:  DON’T FORGET, BILL: organize the PowerPoints for the presenters.  Make sure their presentations are short enough to get done in the time allotted.
  • Write introductions for the presenters.
  • Prepare for student meetings:  Ok three kids in period 7, one kids before school, three more that haven’t yet told me if/ when they’re coming in for help.  Par for the course.
  • Check on thank you gifts being prepared by “Marielle” from the business office. They weren’t ready Friday afternoon. Hopefully here this morning.  Run down to her office to check… “They’re ready in my mailbox, Bill.”   OK…  sprint up to faculty lounge (upper level of campus), get gifts, back to my office, prepare gift bags.
  • Precalculus:  do I quiz  them on problems involving double/half angle trig identities today? They will probably do well on it.  Do I postpone?  Do I give them a choice? Ugh.  Here’s what I DO know: they’re  currently doing a HARD topic (solving HARD trigonometric equations, general and specific solutions), and they are not quite comfortable with that yet. First things first. They really need to practice and wrap their heads around this.  Let’s see what happens when I get to class. I’ll prepare to give a quiz,  but if they want time to work more on equations, I’ll give it the next day.  I’ll poll them and decide in class.  Crap… Let me check their assignment… OK – They will struggle with 17 and 35 for sure.  Those will definitely be on the agenda first thing.  They’re good for extending what we did in class last time.  Prayer:  “Dear Baby Jesus.  Please let me have a quiz in my archives…. Thank you Baby Jesus!”   OK Precalc  adressed.   One AP  Stats class today, not until 5th period.  That’s like DECADES away from right now. Plus, my plans / activities were planned earlier last week. I stayed at school until 6 pm Friday  to be ready for that.  So I’m good… AWW CRAP:  I need to grade one problem for my 5th period class.  OK.  I have time 3rd period to make that happen.  No appointments 3rd period, no worries.

7:30 am: Pre-1st period

A nice colleague “Markus” wants to change the plans for the presentation…  “Are you sure we can’t we do a live simulcast of the event?” I’m sure.  “Sparky” says it’s possible.  Sigh. No it’s not. I did a test-drive on Friday. No go.  I remember to not let others’ enthusiasm turn into my frustration.  I remain calm.

8:00 AM:  1st period, Precalculus

The kids seem alert, talkative and active:  Hallelujah!  I’m convinced that groups are definitely the way to go with this group.  If nothing more than to get them talking to each other about anything   in the morning and not fall asleep. I anticipated their difficulties correctly this morning… Woo Hoo.  It’s very much a “let’s get work done” vibe today.  LOVE IT.  One student want’s to set up a one-on-one meeting with me:  “I’m starting to realize I’m just memorizing instead of understanding.”  YES… He’s a really hard-working, great kid, but is definitely over-extended, in my view: seven classes!  He gets no break for an entire school day.  What compels students to take on this much? Why are kids feeling the need to do this to themselves? Ugh Poor kids.  It’s too much.  It shows on his face, in his approach to learning math. But small victories:  He’s asking for help, and wants help getting concepts, not asking about grades, not asking for procedures. And he’s realizing it on his own. I don’t need to tell him.  I’ll take it.  Small consistent growth produces big changes over time.  Over all, a pretty darn good 1st period class. Lots of misconceptions resolved.  Lots of questions asked/ answered. Lots of kids helping kids.  Lots of me seeing how kids work, and actually helping them.  Lot’s of learning what kids are struggling with right now. They were understanding more than I expected. Whew

8:45 AM: Period 2  

This is the beginning of my LONG BREAK today:  Woo Hoo!   Well sorta.  Period 2 is to make sure that everything will go well during the presentation (after period 2).  I just have to get to the auditorium,  connect with the presenters (a UCLA researcher and a professional dietitian), and connect the student filming the event, No problem.  I go to open the auditorium:  “Excuse me… there’s a class in here.”  

Really?   ARRGH!  I remain calm.  I verified that there was nothing going on period 2 in the auditorium!  Sigh.  OK.   Well, I’ll just double-check the PowerPoints –  Thank God I did. I check my email:  “Markus” sends me two more additional Power Points  to add to the presentation.  (Did I ask for these last week? Yeah, I think so…)  Ok. No worries. I’m locked out of the auditorium anyway. Re-edit the PowerPoints.  No problem…  …. Where are the presenters?  They arrive.  There’s yet ANOTHER version of a PowerPoint to replace.  OK. Get it done. Remain calm.

9:40, Activities Period “Things will go wrong.  You planned for this.”     

Presentation Time! I will be introducing a University researcher, a professional dietitian, a biometrics expert, running their PowerPoints (not a big deal),  and  Skype-ing in a teacher who will be a “guinea pig” for this Wacky Contraption called a BodPOD. But because the room was unavailable before the presentation, I hope/pray that the following  things will be working

  • Computer projector and my computer talk with each other effectively.
  • Audio from my computer connects to the auditorium audio system.
  • There’s enough bandwidth for Skype to work like it did Friday Afternoon.

To my surprise, the Head of the Upper School, Head of School, and Head of Athletics come to the event.  So do about 30 students (YAY) , 5 coaches, and  about 8 math/science teachers. Better attendance than I expected.  As people file into the presentation, I apologize to the previous teacher for accidentally interrupting his class 2nd period, and he’s gracious about the slip up.  Here we go… Aww crap.  Audio Not Working.  Internet (and thus Skype) not working. Where’s the audio pluggy thingy that was here Friday?  Why isn’t Skype working?  Frownie Face.  While I try to troubleshoot this issues, Two of my students blitz me with an AP Statistics question 2 minutes before the presentation is about to start.  Hey, at least they’re getting help and asking a good question.  … OK, perspective:  We have video.  That’s the most important.  I’ll work on audio later.  Tech problems bedamned, I decide to start the presentation, and do the intro.  The researcher and the dietitian are great. Kids/ teachers/ coaches are engaged.  I smile like a game show host, and scramble to get Skype working behind the scenes.  Time for questions: One science teacher begins to critique the study design.  I think to myself… Let the kids raise questions. This is for them, not us.  The kids will get there.  The researcher does a beautiful job addressing the teacher’s critique  and reassuring him that she knows how to do run/interpret a study. I wish the students were given a chance to raise this question.   Is Skype working?  Maybe!  I try it… Ugh.  spotty audio, no video.  Bandwidth  is lacking!  Frownie Face.

Time to call an “audible.”   Thankfully the truck containing the BodPod is about 20 yards outside the auditorium.  “Let’s take a field trip over there, shall we?”   This turns out to be a good move.  Kids get to see the device, ask the technician questions, and be a bit more “hands on” with the presentation.   Thank you’s all around.  Good feelings, interested kids, happy leaders on campus.  Blood Pressure reducing.  Success emerging.   Whew. I hope.

10:15 AM:  Periods 3-4:   I actually can get some work done?
Shockingly, Yes… Monday is a day where I may have four non-teaching free periods (minus meetings with kids / colleagues that emerge).  Other teaching days,  only one  or 2 free periods.   I get two class’s papers marked and record the grades in my gradebook! This is a lucky two periods.  A couple students pop in for some quick questions, and I’m able to help them work through their struggles pretty quickly. I have time to grab lunch and check email for 20 minutes!  Woo Hoo! I re-check my plans for 5th period AP Stats class… Lots to do today. But I am prepared.

11:55 AM: Period 5: AP Stats–Day One of learning about probability in depth.
We work through three activities to give students a sense of what probability of an event means. Time is a premium here. I want to work through these activities efficiently: get to the thinking, don’t waste time.  Each one works pretty well (I think) … The first one:

1. Using a simulation with dice to answer the following question: “1/6 of bottles of soda have a cap that says “You’re a winner!”  Seven friends each buy a bottle.  Three are winners.  How surprising is this?

2.  Imagine flipping a coin.  Record the result.  Imagine a second flip. record the result. now Imagine a  sequence of 50 coin flips. Write down the results.  Record the distribution of “streak lengths.”  Now let’s flip 50 coins.  We work as a class to make this happen quickly.

3. Use this Java Applet to help students construct an understanding of what it means to say that the probability of an event is 50%.  “Where’s the 50% in the graph?”

Most students pay attention and respond thoughtfully to the questions I prepared in their handouts.  I always worry about “being efficient” in getting through things quickly. Is the learning retained? You tend to convince yourself things are working, and  you’re sometimes wrong.  Time will tell.

12:45 pm, Period 6:  These kids want to do WHAT?
Students from 5th period provided me with proposals for an experiment on response bias. I’m reviewing them and giving them feedback via e-mail.  In short, they need to pose a question two different ways to subjects, and compare the results.  I have to approve these before they are given the green light to collect data.  A few are very good. Most are OK, and can become very good with greater attention to the practical details of executing their project. And then one proposal is… um… Oh no my dear students, no no no…   Let’s think about this more. I think through the questions I must ask these students… The following come to mind: How might you approach this topic so that your plan is not breaking school rules?  Can you see how  these questions might be… inappropriate (to practically everbody?)  Sigh.  I will definitely need to work with this group to guide them towards something more appropriate.  

Period 7: So many students at my desk!

I have five appointments with students this period. Plus a couple more drop in.  Make it work, Bill.  I get one pair of precalculus students to work together effectively, with some help from me. “Can I try to answer his question, Mr. Thill?”  YES.  Small victory. She does a great job, and her classmate starts to get it. Two more precalc students pop in.  I get them to work together too.  They have class with me 8th period, so some of their questions can get answered then. Two more AP stats students get advice about their project proposal.  Wow:  time for 8th period precalc class.

8th Period: Precalc: last class of the day.
Like my first period class, the students have a few challenges with the complexities of solving trigonometric equations. There’s a lot of “business” to address in this class: recap the “greatest hits” kids took on the most recent test, and share a list of “intangibles” that the precalculus teachers put together that help students understand what approaches to math class & problem solving tend to yield success in future mathematics. I have been pleased with my 8th period students’ approach so far: they ask lots of questions of each other, and work together collaboratively and effectively. Students who have shown some struggles are assertive and self-reliant on making progress and seeking help. They respond to setbacks wisely and take actions to make improvements. I say “Thank you” to myself at the end of the day when these students leave the class… they make the end of the class day such a a joy.  

3:30 pm… After school: Work time begins.

I really need to go running tonight. I have 1.5 hours of daylight left. I have lots to do for tomorrow. Two classes of short assignments to grade. Doable before 1st period tomorrow. OK. At this point, I realize my debit card is missing. Ugh. One more thing. I have to call my bank and cancel it. Not now. I think about a student I have who was out of school again today. She’s dealing with some VERY heavy stuff right now. No update from her or her advisor.  I worry a bit. I hope she’s doing OK. I think about the conversations I need to have with some students: the ones with the sketchy project proposal, the ones struggling in precalc, the ones who could “slip through the cracks” if I son’t stay in conversation with them.  What’s up for tomorrow? Create a short assessment for precalculus. Check my phone: when’s the hubby coming home? He’s on the way home already. What’s still not done?  I need to update my precalculus website and get the current lessons up there… …sunset is coming.  No run tonight.

5:40 pm: Home Time. 

Yay! Hubby cooked dinner! I am very lucky. I talk with him. Time to de-compress. I should be running right now. I hate running on the city streets in the dark. Too many things to trip on.  I call to cancel / replace my debit card. I scarf down some food.  I open my e-mail…. I really want to do this “A day in the life” blogging initiative. I will work on that and watch some TV.

6:30 pm. 

I start blogging about my day. A lot went on.

10:45 pm 

Finally finish this blog post.  I realize that blogging takes a ton of time for me.  I remind myself why I have put blogging on the back burner.  I marvel at those who stay current with it.  Hubby tells be it’s time to get to bed.  I agree.  6 hours until the next day starts.

Posted in Uncategorized | Tagged , , , , | 2 Comments